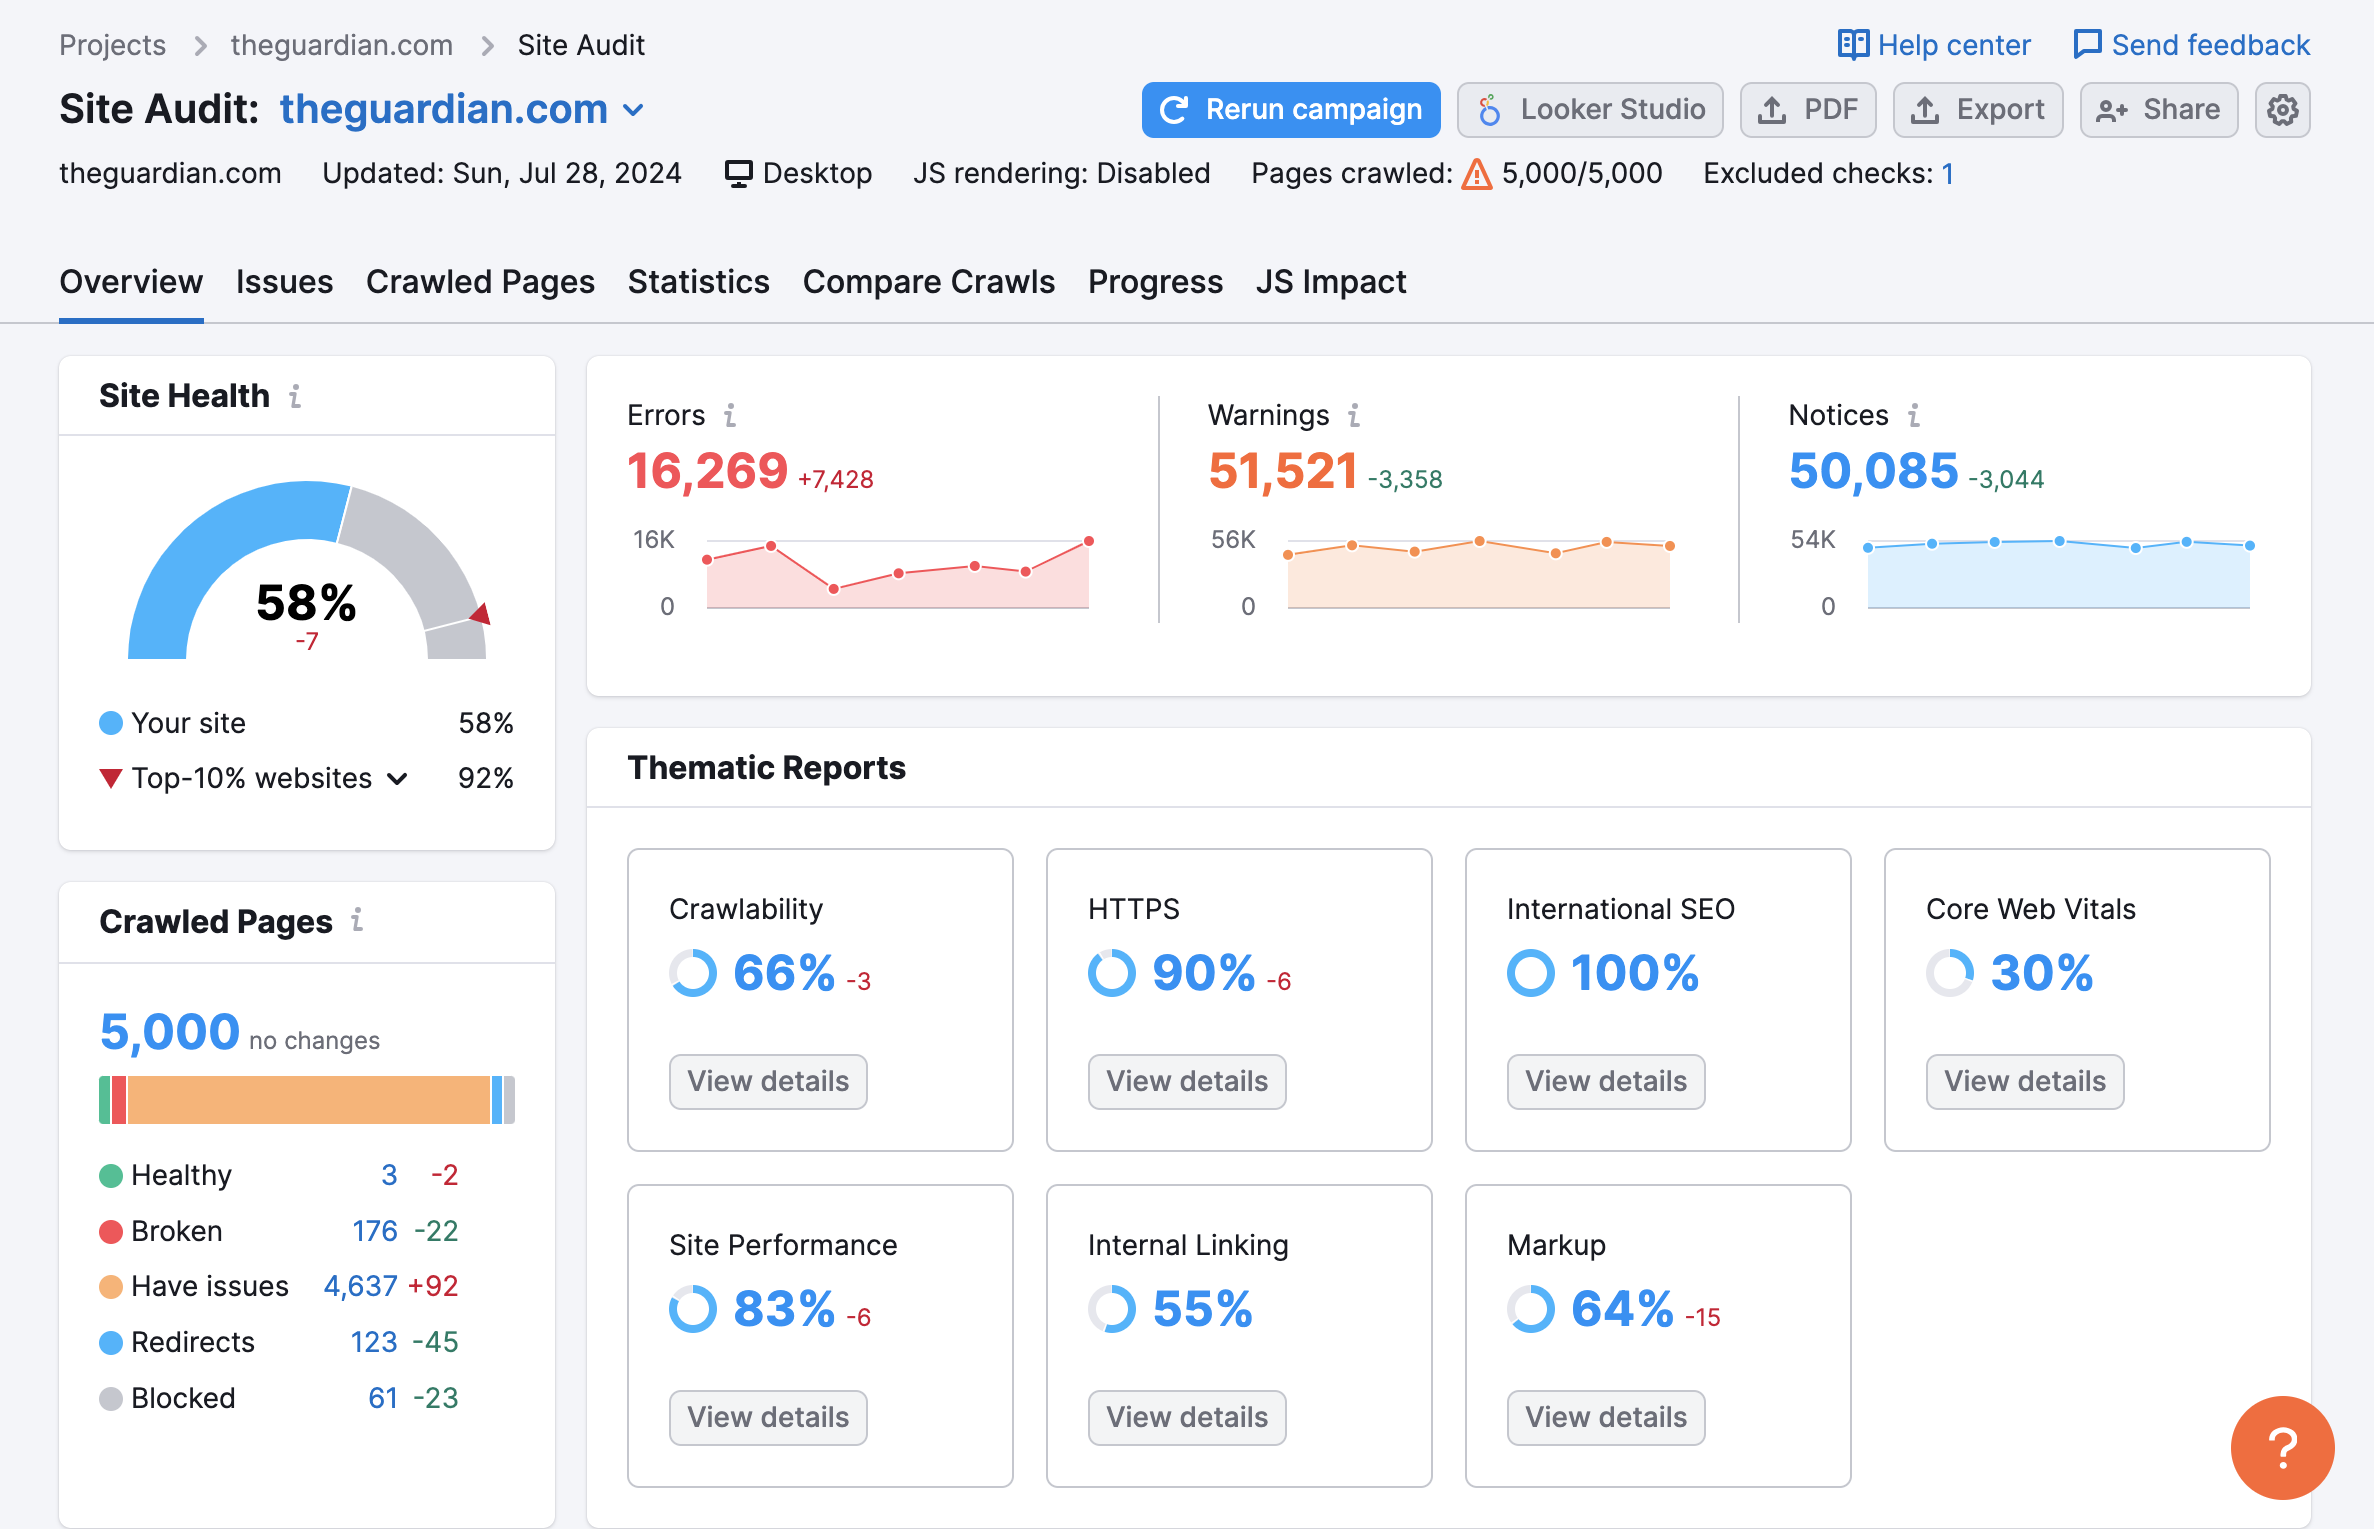
From the Overview report, you’ll see seven preview widgets for more detailed reports: Crawlability, HTTPS Implementation, International SEO, Performance, Internal Linking, Markups, and Core Web Vitals.
Crawlability
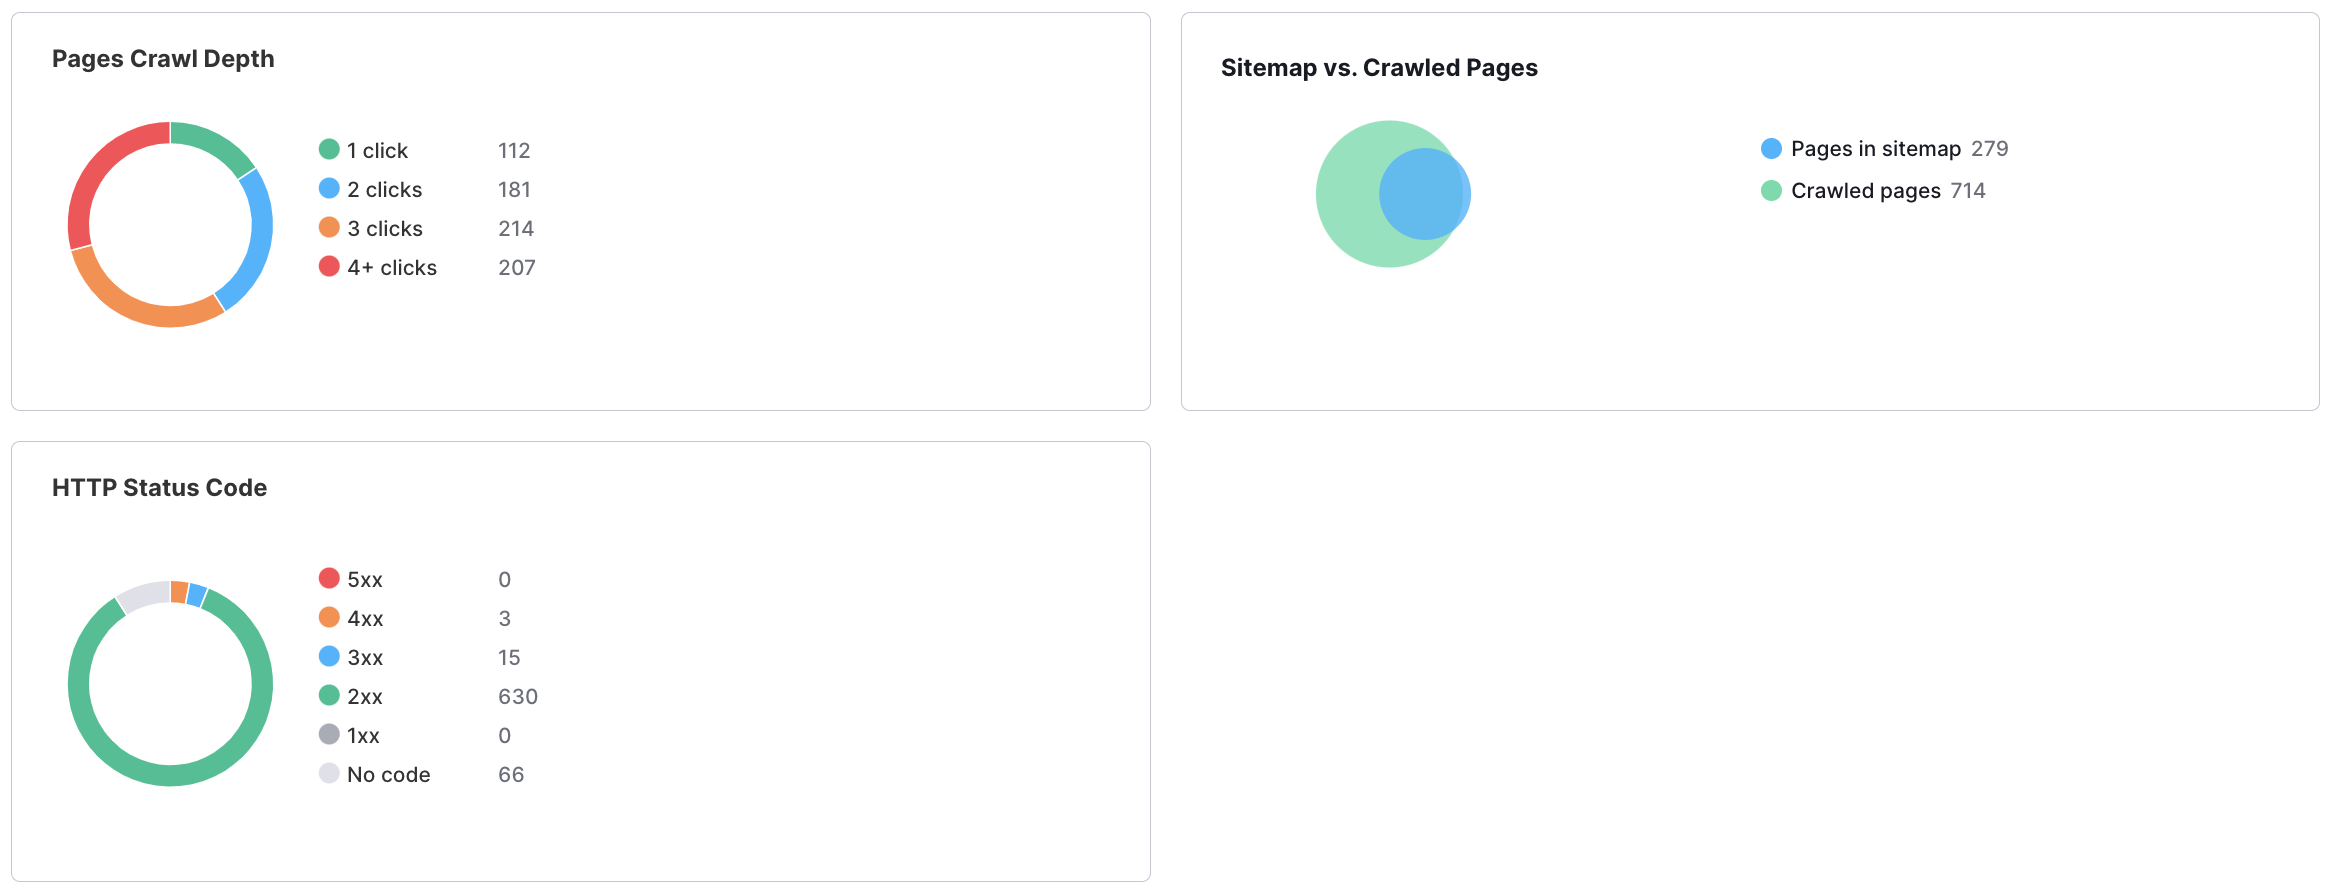
The Crawlability report gives you an overview analysis of the site elements affecting how search engines crawl your site. Most of the graphs on this page are clickable and will redirect you to a filtered Crawled Pages report with the specific pages where we saw such an issue.
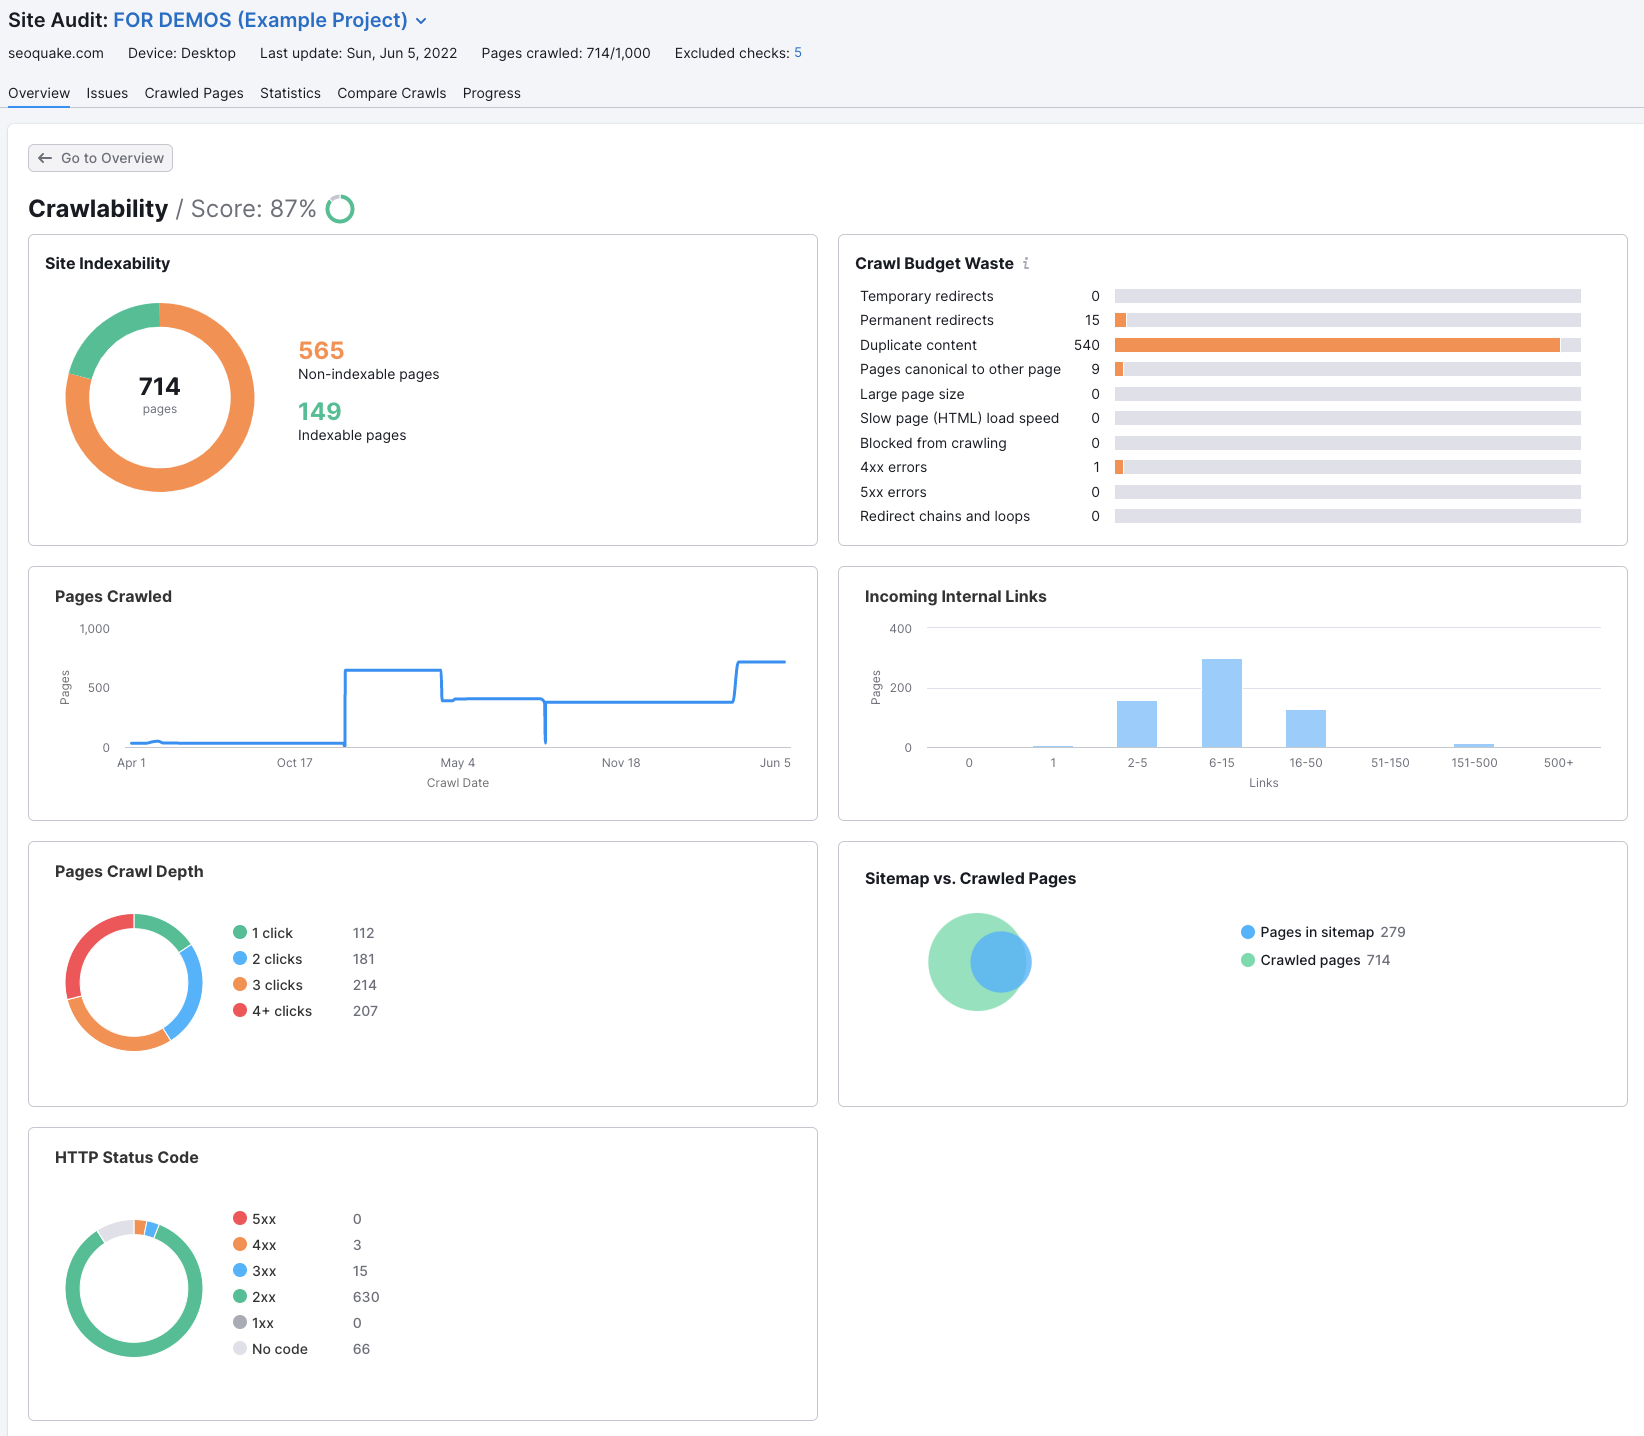
You can also see the crawl depth (how many clicks from the home page it takes to get to each page), HTTP status codes (for any broken pages, redirects, and server-side errors), and a sitemap vs. crawled pages comparison.
It is recommended that you keep your crawl depth under 3 clicks to let users and search engines easily find your important content. If the number of pages specified in your sitemap.xml doesn't match the number of crawled pages, it may be a sign that your website has poor crawlability due to ineffective linking or technical issues.
If you want to save this analysis, it can be exported to a PDF with the button at the top right corner of the interface labeled “PDF.”
HTTPS Implementation
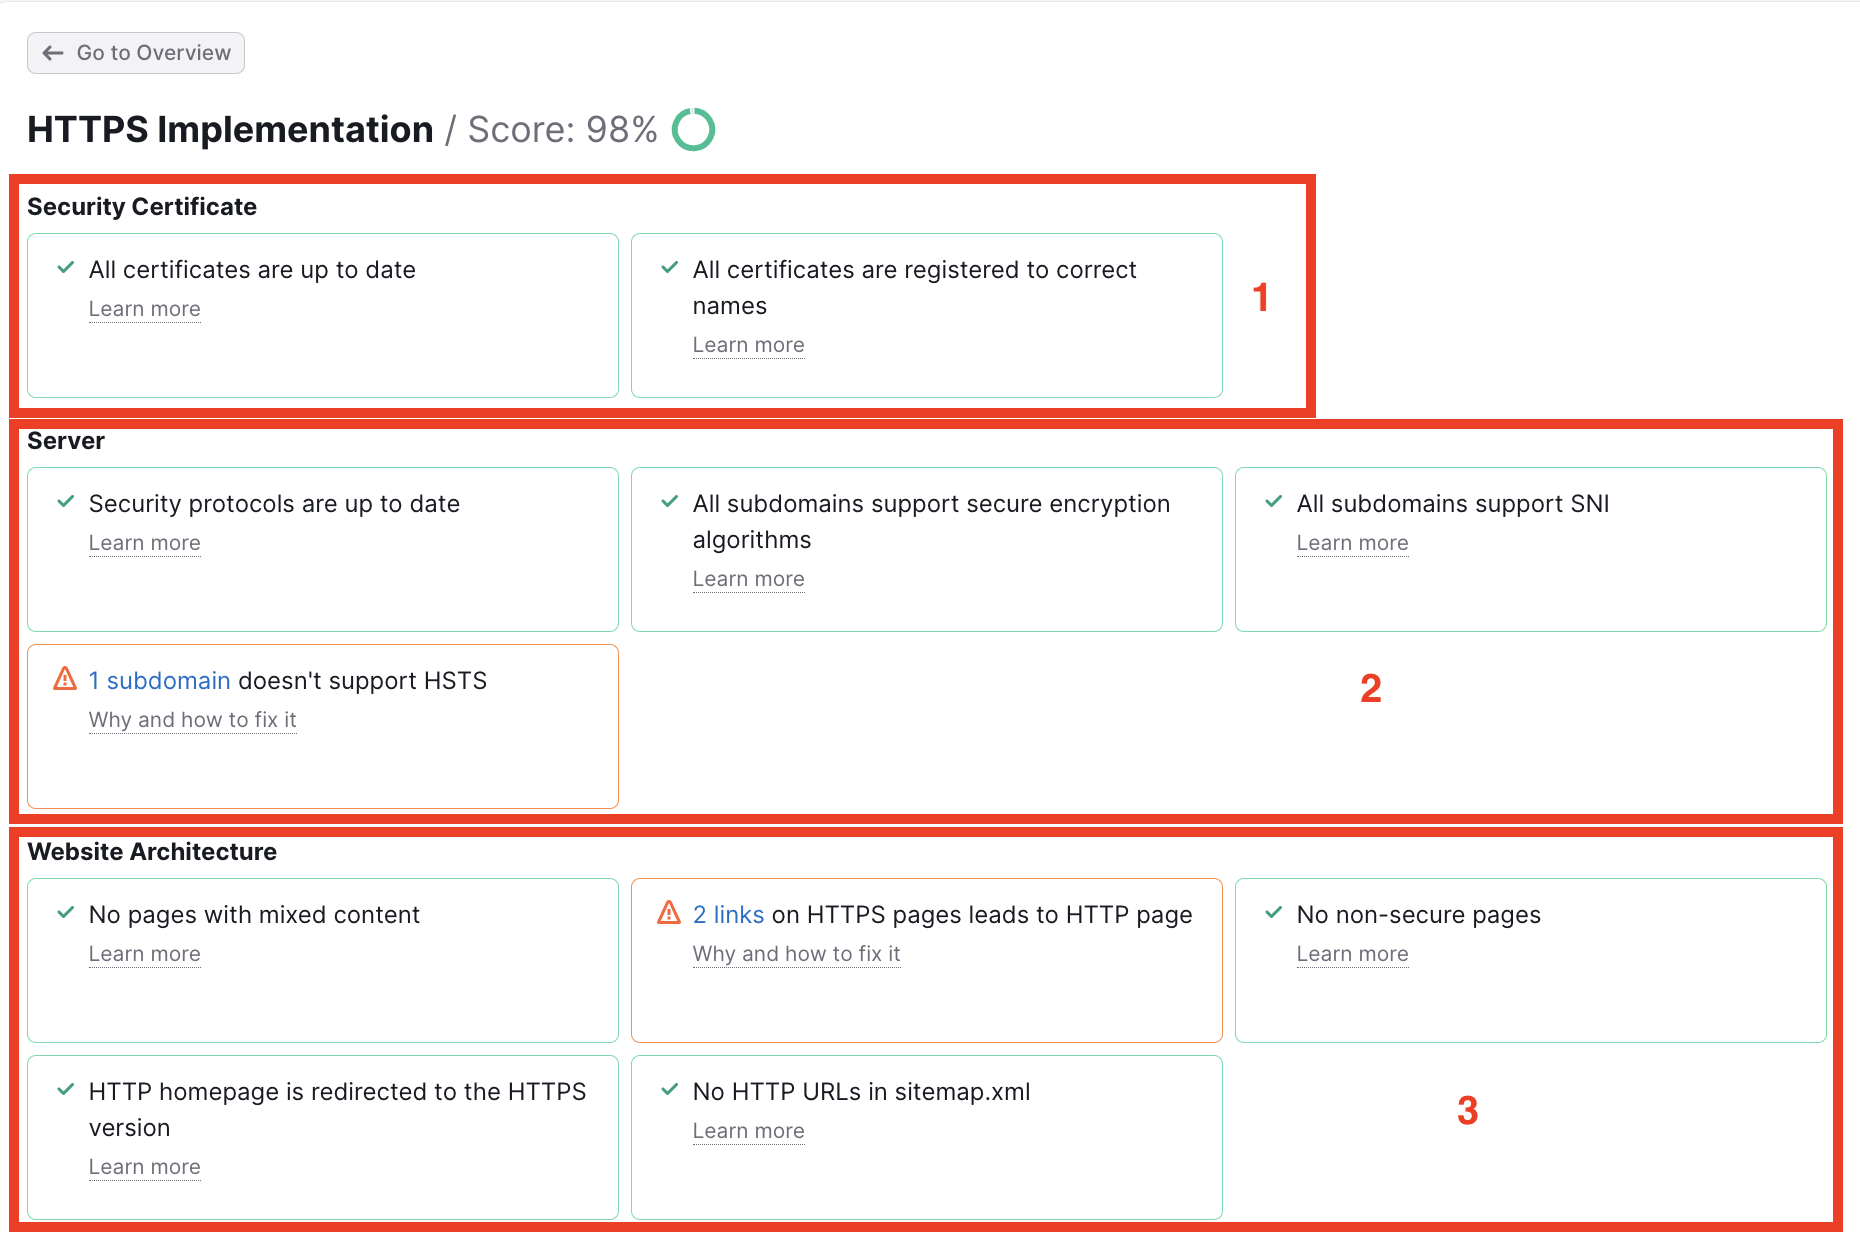
Website security is becoming more important to SEO, especially as Google encourages website owners to adopt HTTPS. The HTTPS Implementation report will provide a report on all of the potential issues surrounding certificate registration (1), server support (2), and website architecture (3). Just click on one of the blocks for an explanation of what the issue is and how to fix it.
International SEO
If you operate a global website, you’ll want to make sure your site loads in the correct language of your visitors. To do this, you need to use the Hreflang attribute (rel="alternate" hreflang="x") properly.
Hreflang is an HTML attribute that tells search engines the right language and regional versions of a website to serve Internet users across the world. The attribute can be applied to a website’s HTML, XML sitemap, or HTTP to specify a web document's language and regional URL.
At this time, Semrush only checks the HTML of your site to look for these tags.
Correct usage of this tag ensures that visitors from around the globe will be served the website in their preferred language and geographic tone (for example, the English language in Ireland vs. the English language in the United States).
If you’ve previously tried checking your website’s use of Hreflang, it was probably a time-consuming, manual process. With this new feature of Site Audit, you can analyze your website’s tag usage in a matter of moments.
With this report, you will get:
- A list of your website's pages with hreflang tags
- Analysis of improper hreflang codes and why they’re wrong
- Analysis of potentially missing hreflang tags
Data concerning missing hreflang attributes is based on the total number of language versions the Site Audit bot found while crawling your website. We'll consider this a potential issue if we detect a language version that isn’t listed on a specific page. As we do understand that some hreflangs may not be specified on your pages deliberately, keep in mind that the information we provide should not be used as a guide to action. It is provided solely for informative purposes.
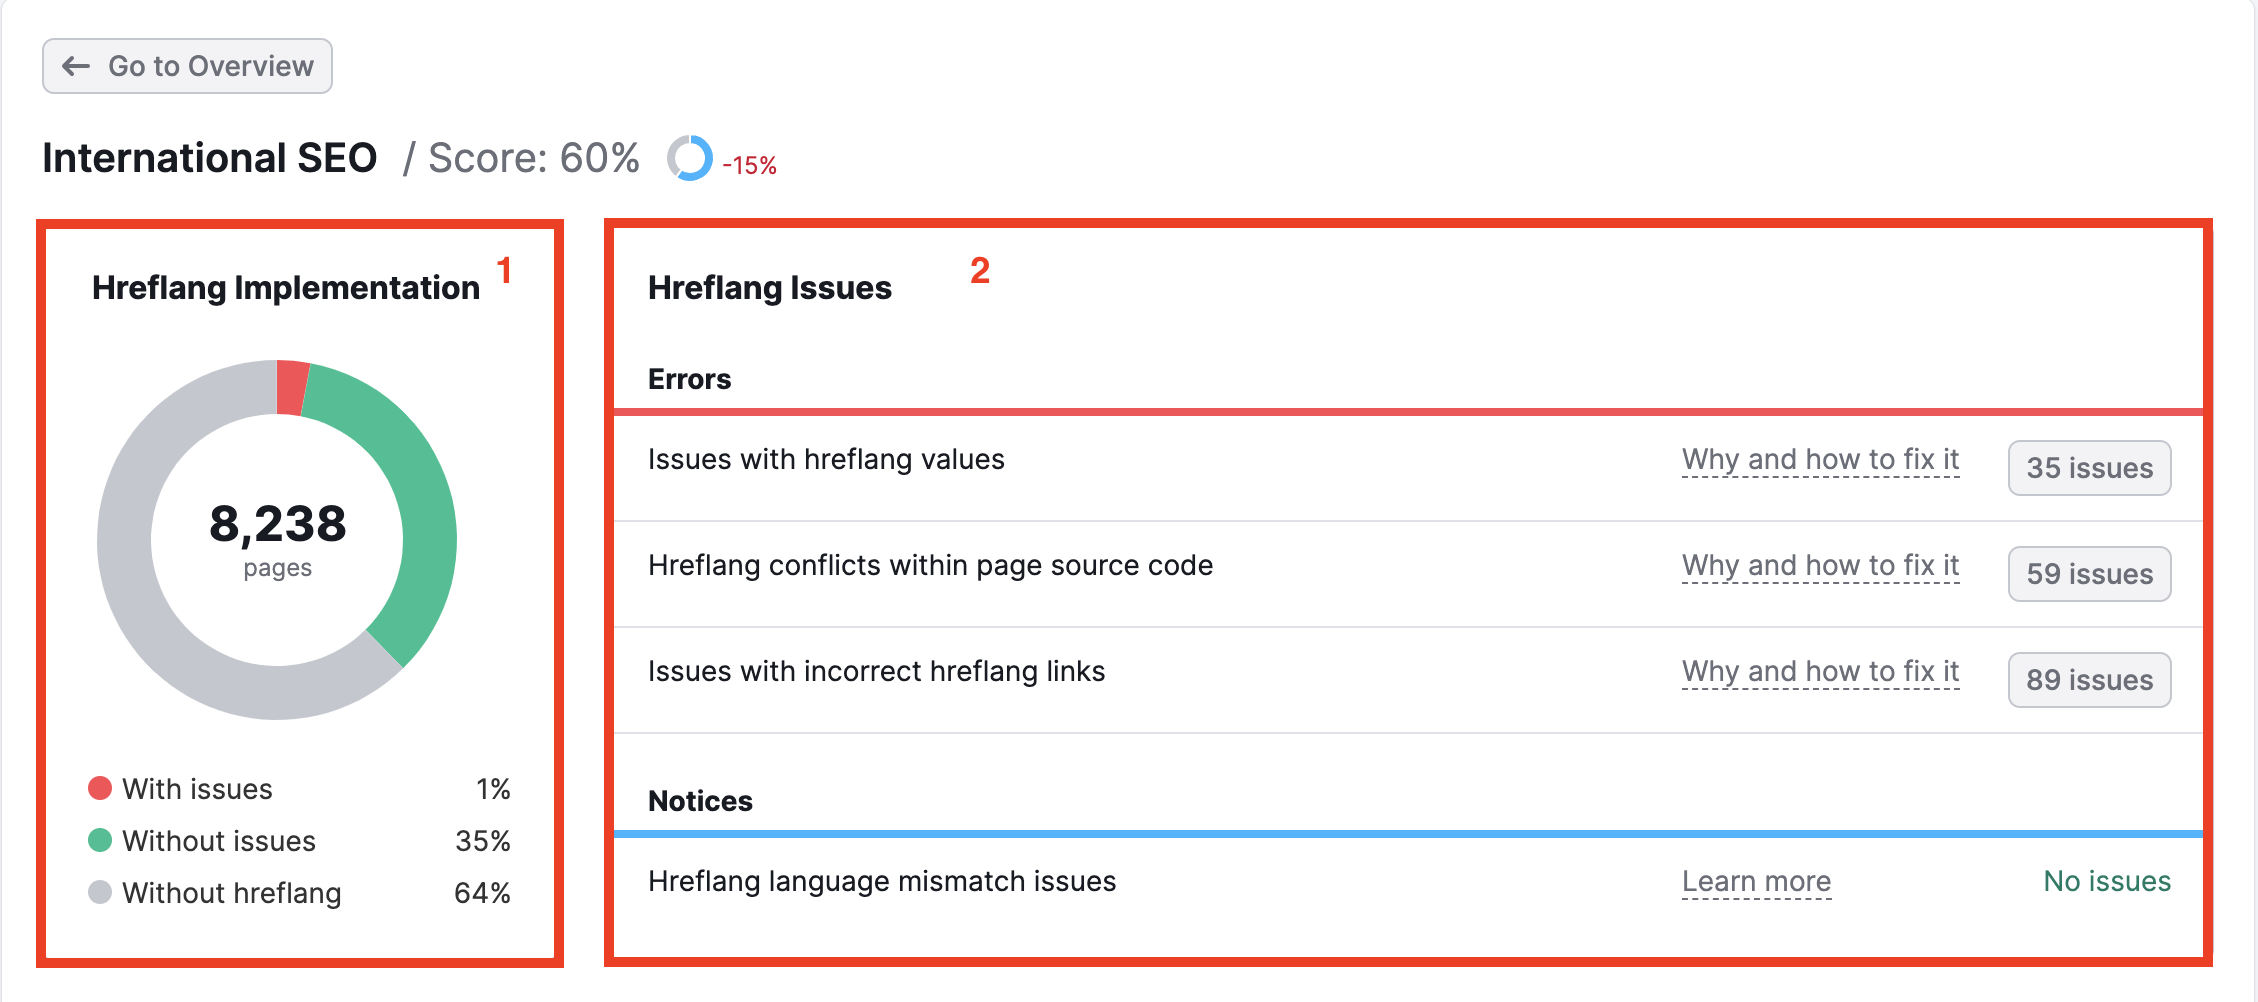
1. The circle chart on the left shows your site’s implementation of hreflang. The number in the middle of the circle represents the total number of pages that the Site Audit crawled. The colored bars show how many pages have hreflang tags in their coding.
The gray section indicates how many pages from the crawl do not use hreflang. The green indicates how many pages use hreflang correctly, and the red indicates how many pages have hreflang issues.
Click on the red bar in the circle graph to open a pre-filtered Crawled Pages report showing the specific pages with issues.
2. To the right, the hreflang issues are broken down into Errors and Notices. Click on the button that says the number of issues to see them listed in the Issues tab of your Site Audit.
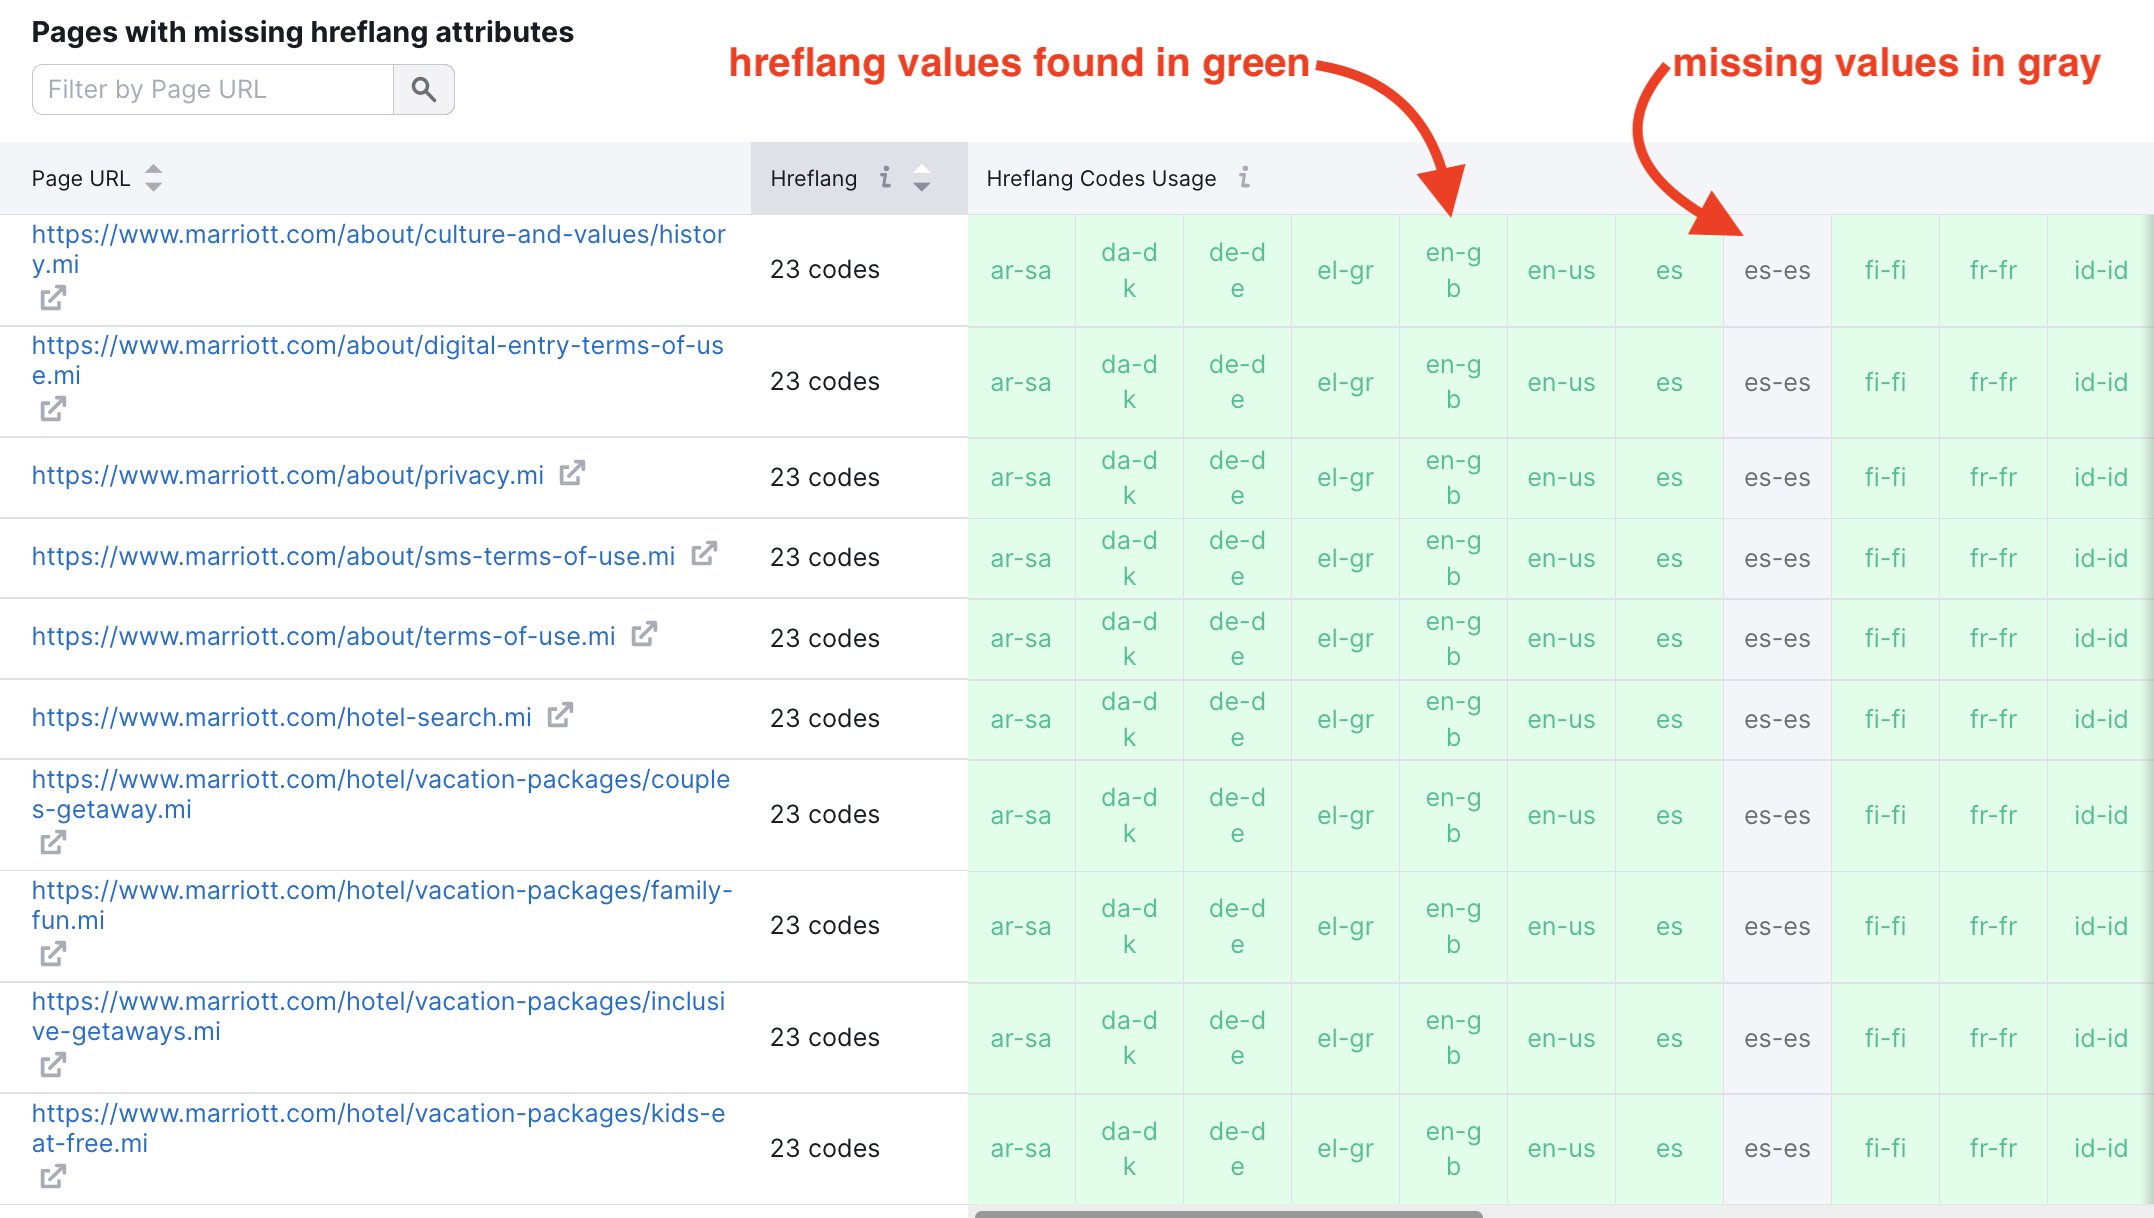
At the bottom of the report is a table listing all the pages that may be missing hreflang attributes. For each webpage, you can see which hreflang values were found (in green boxes) and which values were missing (in gray boxes).
To learn more, read our blog post on how to do international SEO with Semrush.
Performance Report
The Performance report in Site Audit scans CSS and Javascript resources on the pages of a website for all speed-related issues.
Issues that this report checks for include:
- Large HTML page size
- Redirect chains and loops
- Slow page load speed
- Uncompressed pages
- Uncompressed JavaScript and CSS files
- Uncached JavaScript and CSS files
- Too large JavaScript and CSS total size
- Too many JavaScript and CSS files
- Unminified JavaScript and CSS files
- Slow average document interactive time
You’ll be able to quickly analyze the average HTML load speed of your website’s pages as well as a breakdown by load time (0-0.5s, 0.5-1s, 1-3s, and >3s).
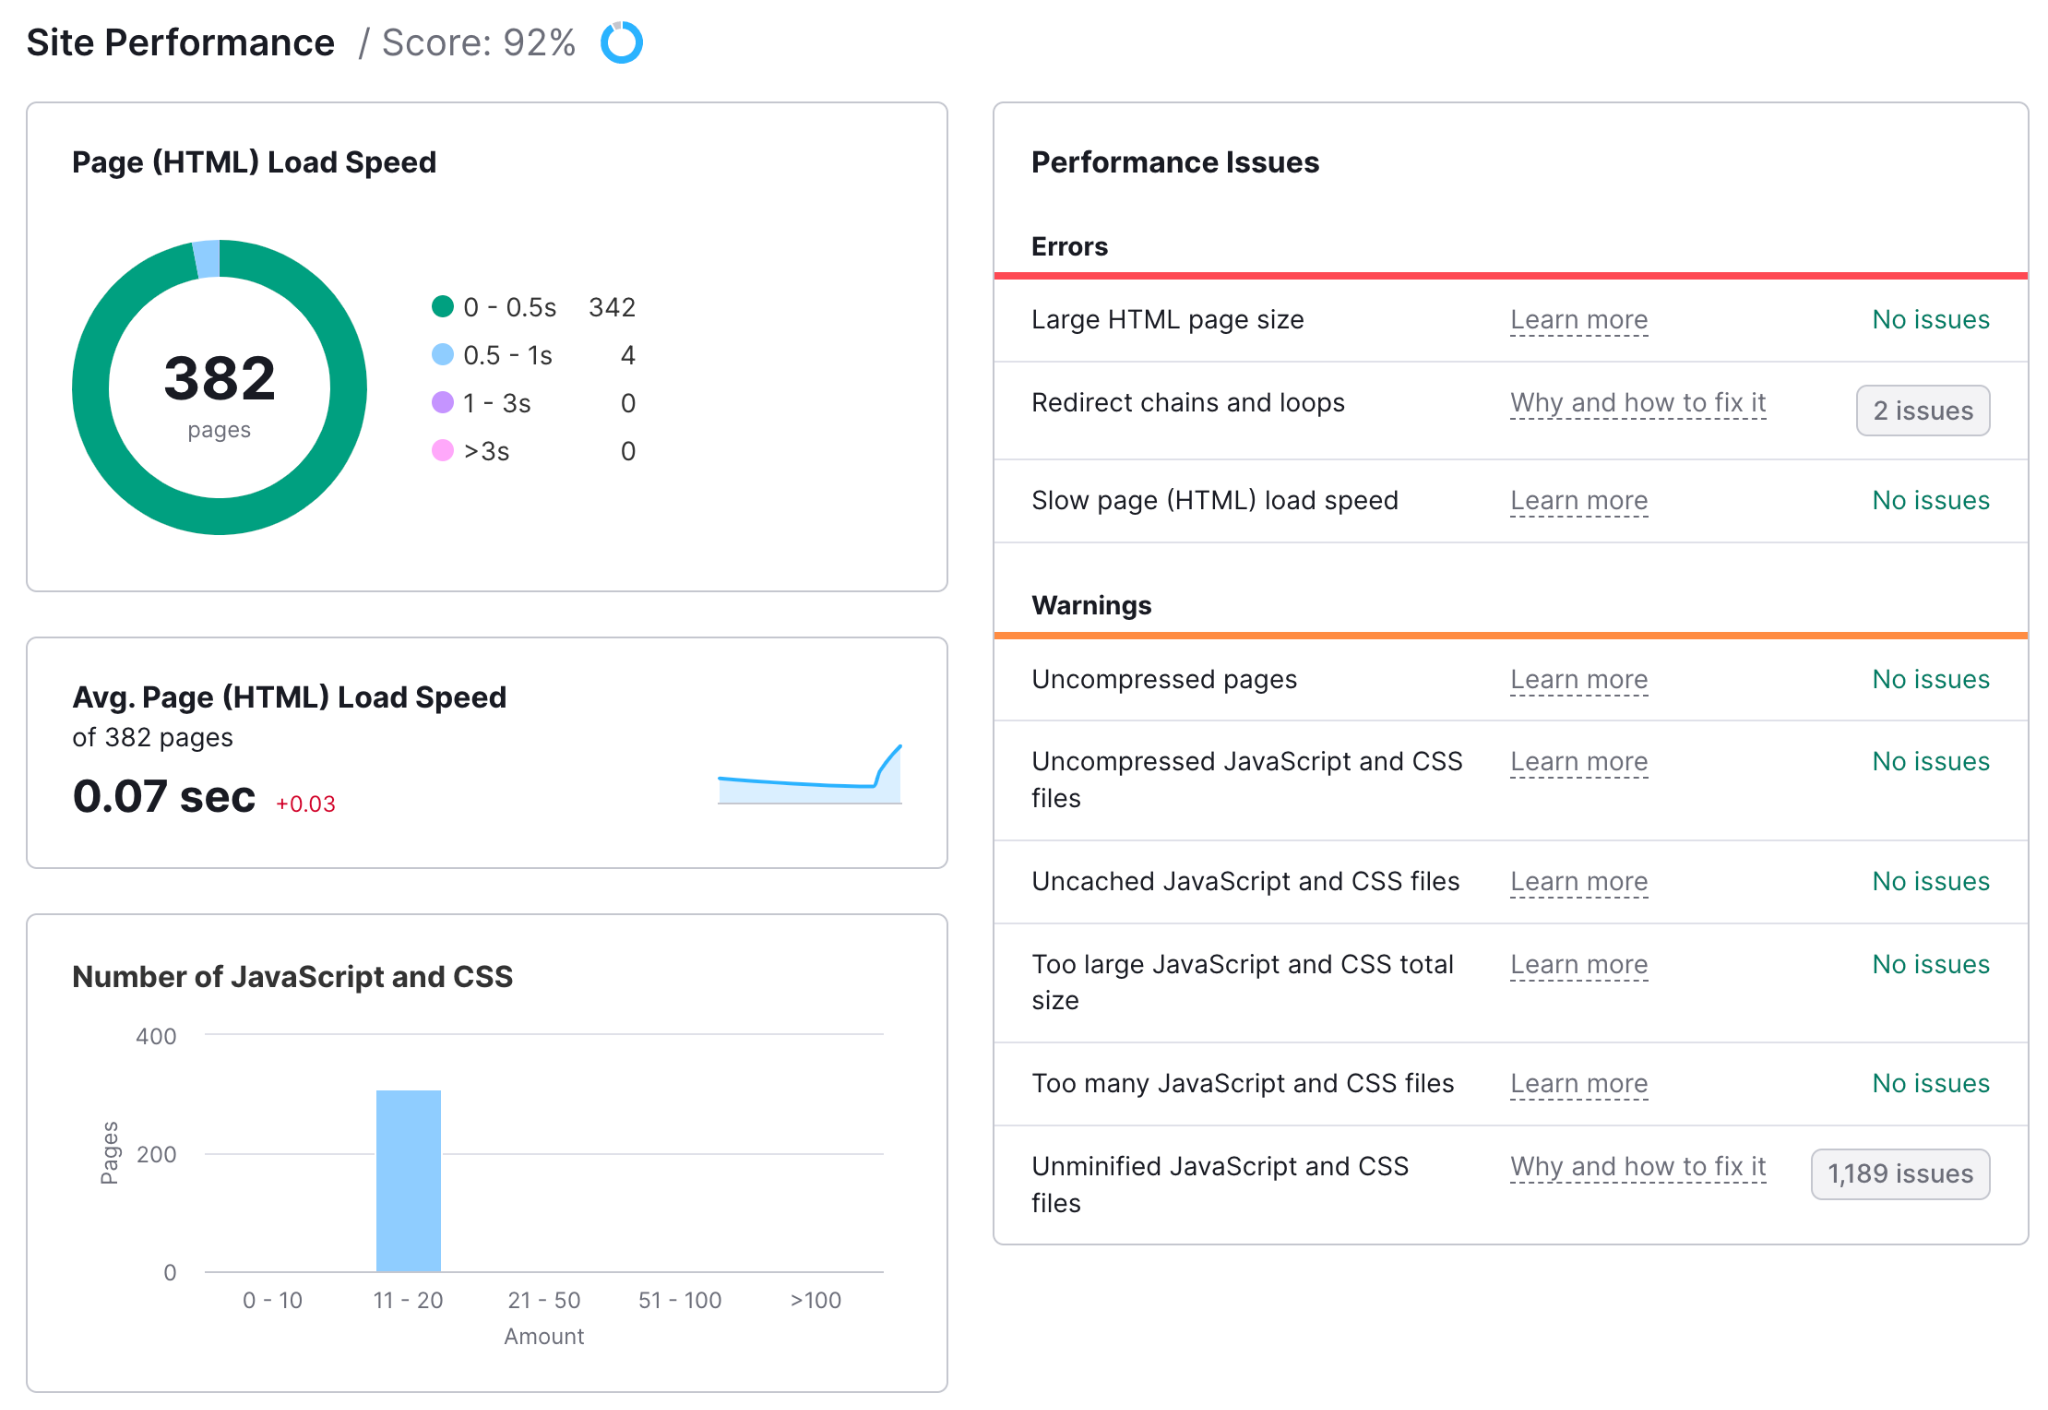
If your score went up or down since the last crawl, it will be noted in the green or red text.
Please note that the HTML load speed of a page does not factor in the load time of images, JavaScript, or CSS files.
The Avg. Page (HTML) Load Speed displays a trend of any improvement/decline of your website’s speed over time so you can tell if your optimization efforts are paying off.
Generally speaking, trying to have your pages load in under 1 second is recommended. Longer page load times impact the user experience and can lead to visitors leaving your website.
The number of JavaScript and CSS shows your pages' breakdown based on the number of JS & CSS files they have and allows you to find pages with too many webpage resources. Click on a column to check a particular page’s number of JS & CSS files in a filtered Crawled Pages report.
JavaScript and CSS Size shows your pages’ breakdown based on their JS & CSS size and allows you to identify the pages on the website with the largest files of code. Click on a column to find the JS & CSS file sizes for a particular page in a filtered Crawled Pages report.
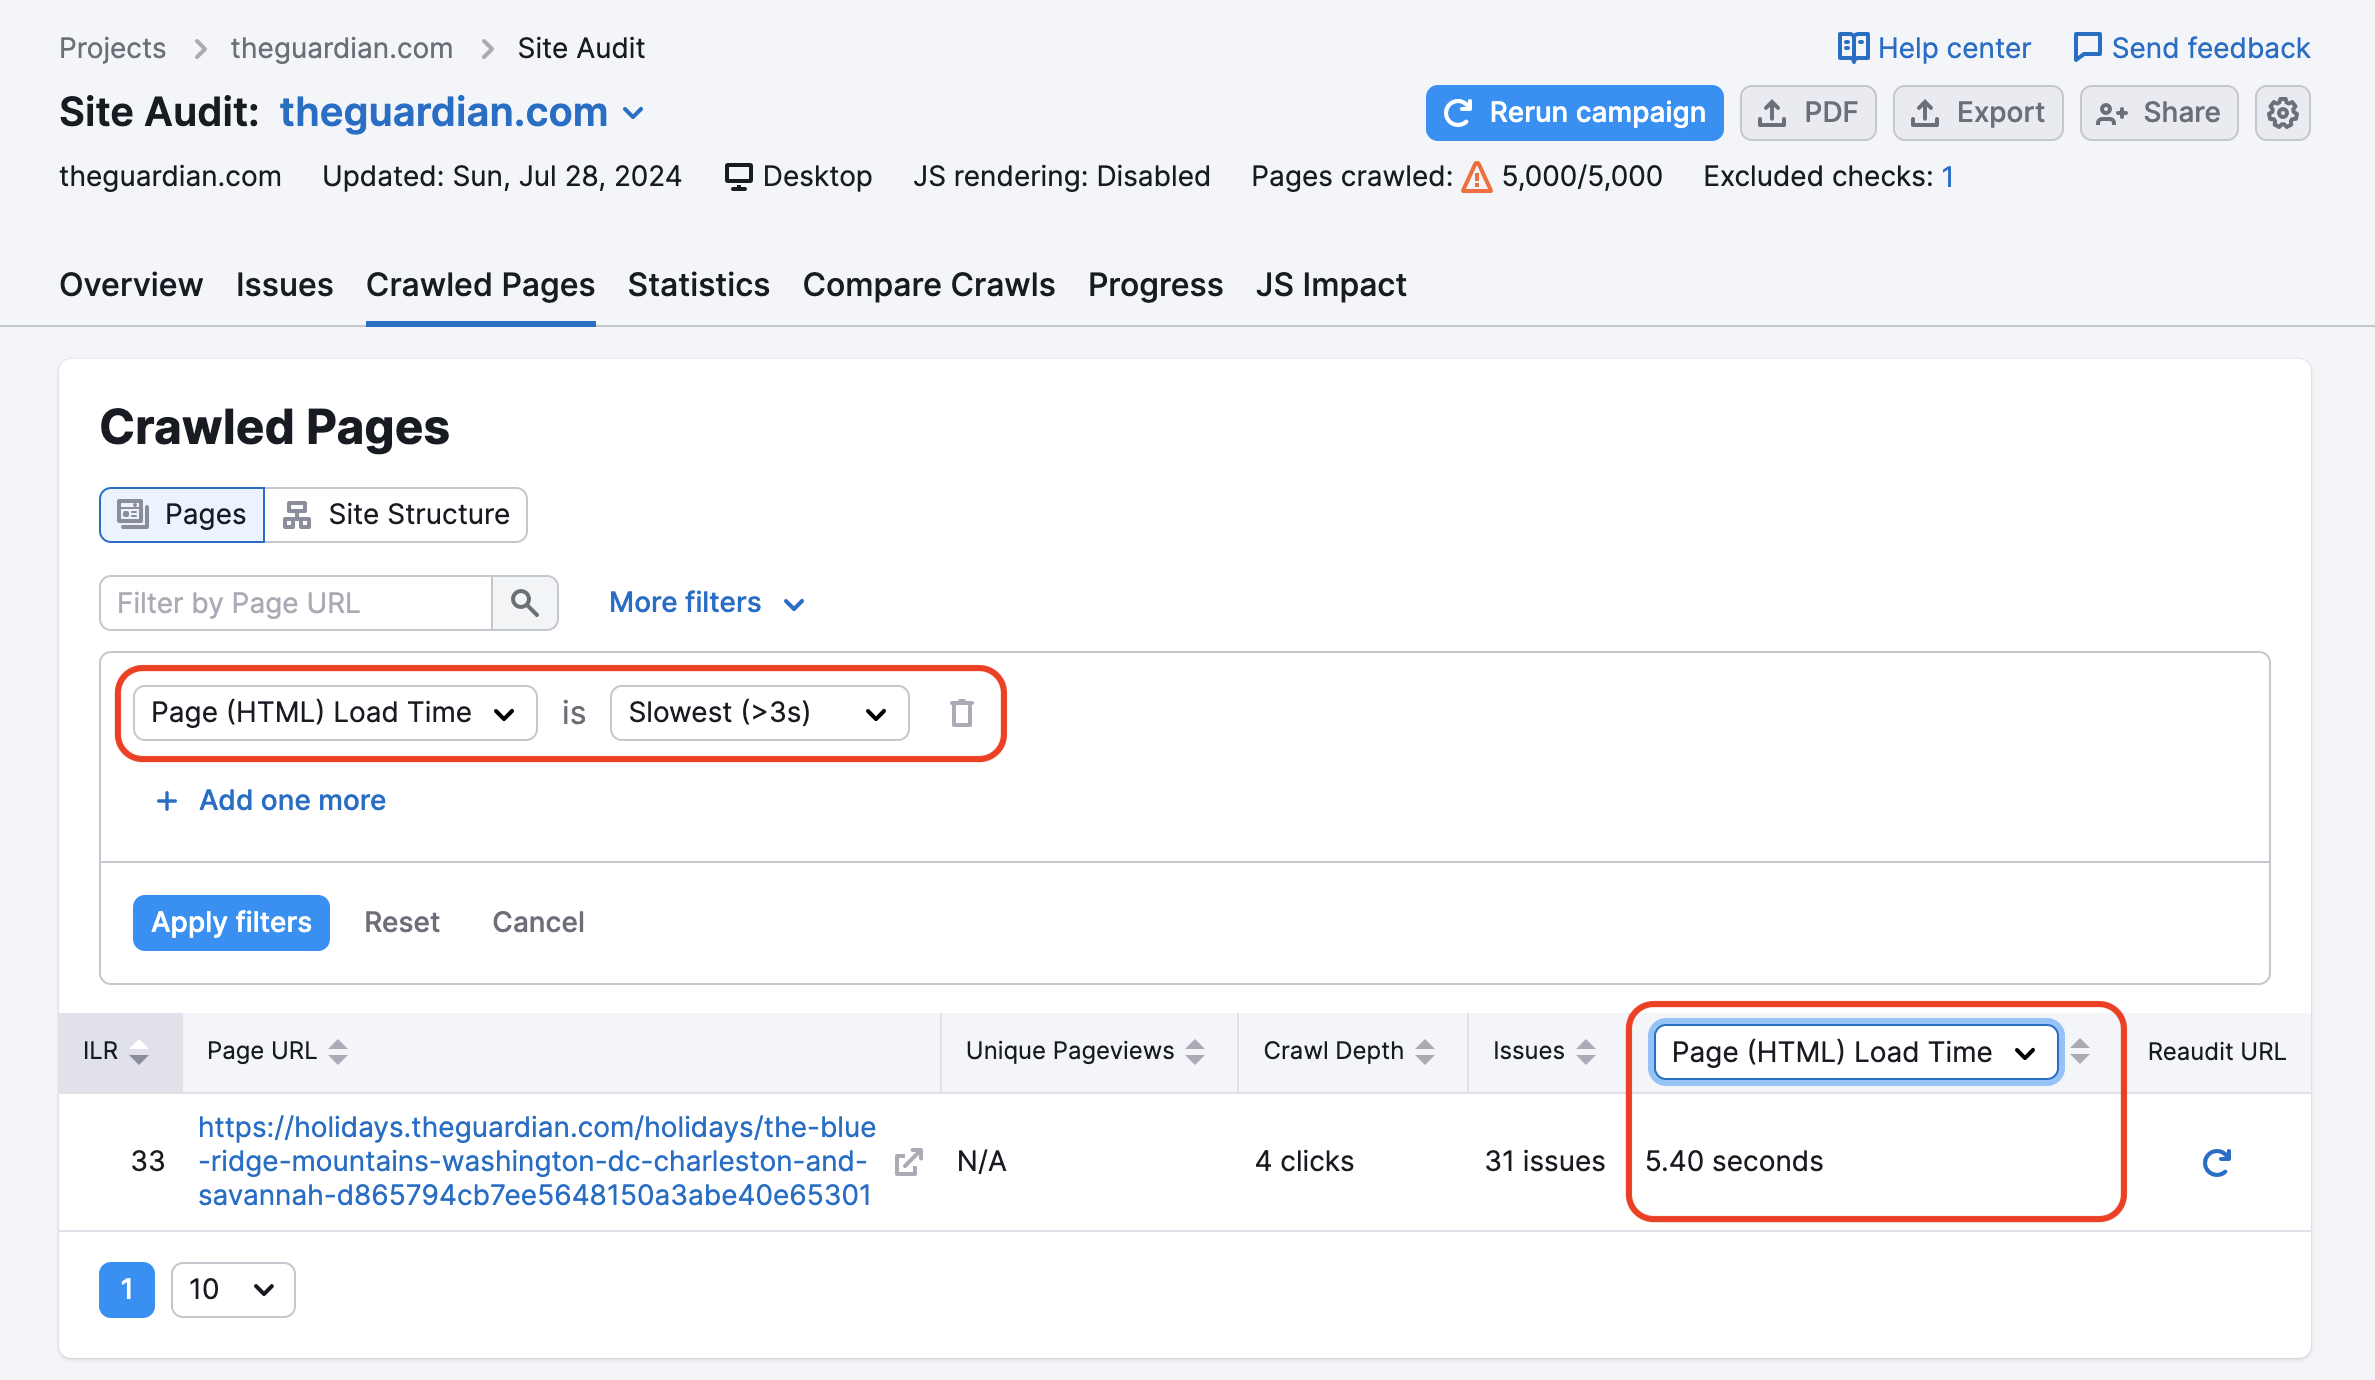
If you click on any of the Page Load Speed chart segments, you’ll jump into a filtered Crawled Pages report. From there, you can see how long each takes to load its HTML.
How to Improve Your Site Speed
If you see that your website is getting a poor report on speed and performance, here are some tips to reduce loading time and serve content faster:
- Reduce the size of images and other media
- Minimize HTTP requests
- Implement browser caching
- Choose an appropriate hosting provider for your website’s size
- Enable file compression
- Use a CDN
- Minify CSS and Javascript files
Internal Linking
Like external linking, internal links can also help boost the authority of a webpage. For example, if you are linking to a product page from a homepage, that link will be passing along some of the homepage's authority.
This report will show you the pages on a website with high click depth that are hard to find, as well as any broken links and the pages with the most Internal LinkRank.
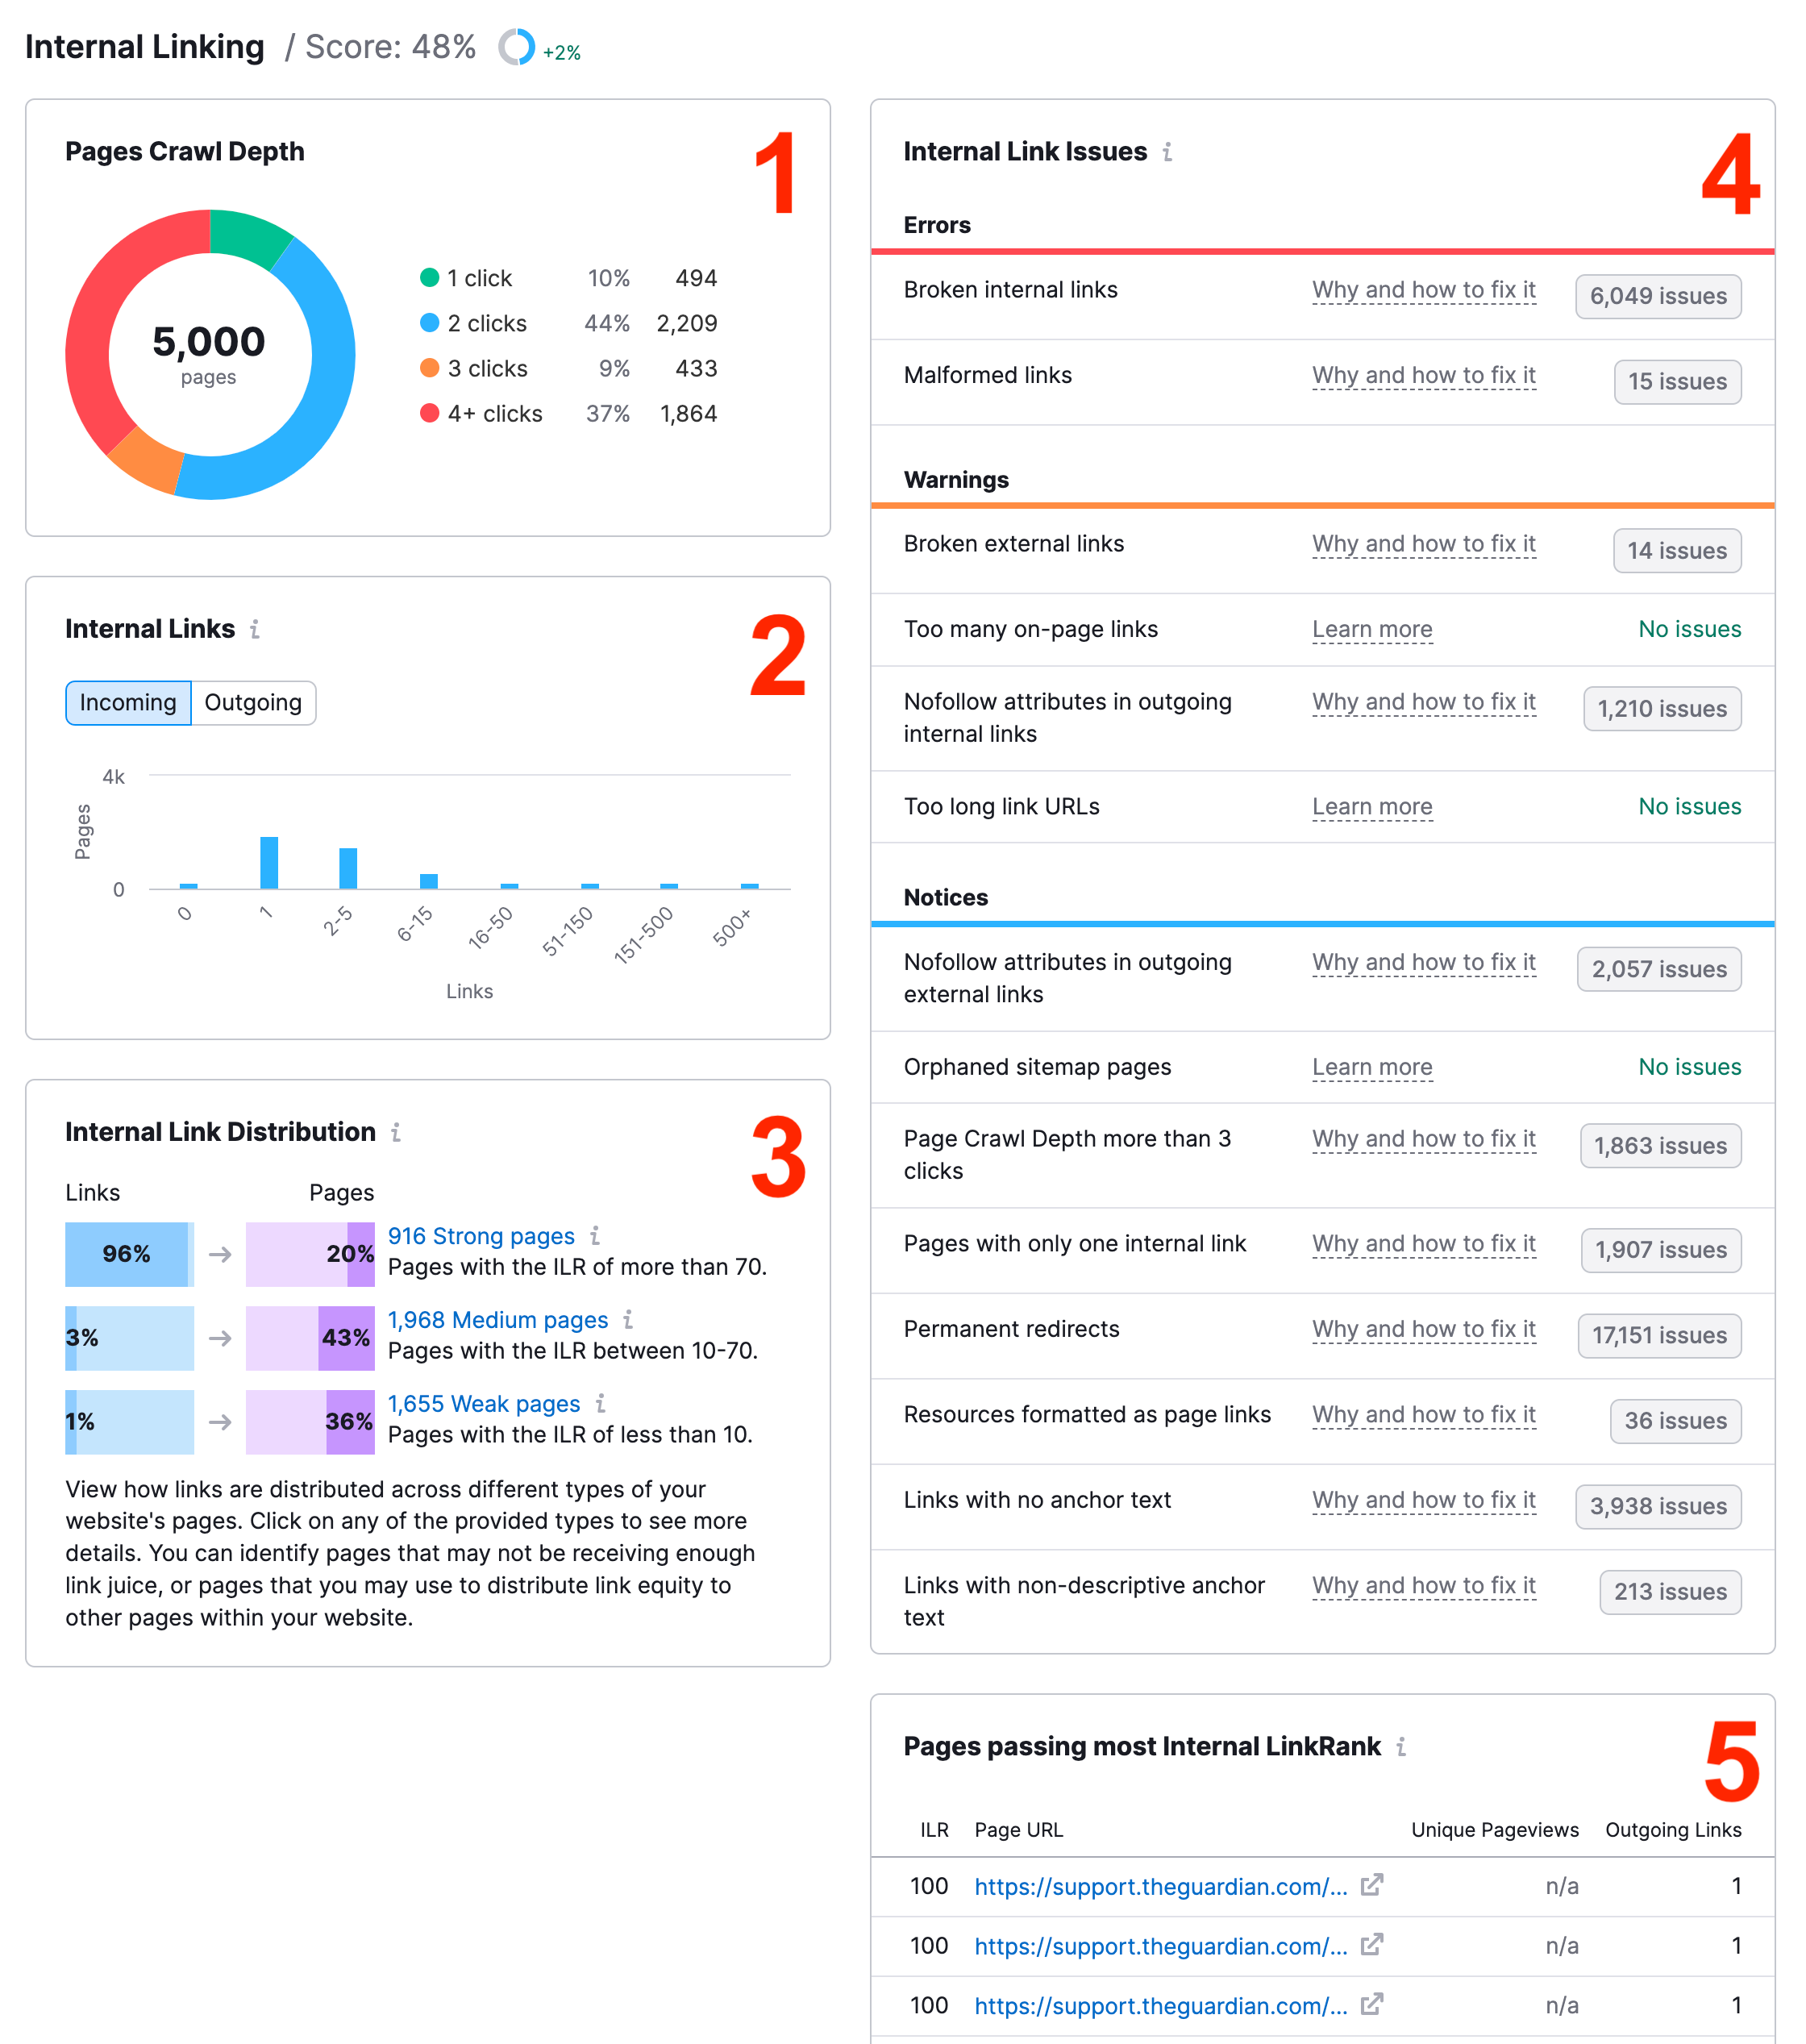
After clicking on the internal linking widget you will see a full in-depth analysis of your website’s internal links. This will be broken down into five main sections:
- Pages Crawl Depth: How many clicks it takes from the home page to reach the pages on a website. If it takes more than three clicks to reach important pages, a better internal linking strategy could improve the site’s crawlability.
- Internal Links: This shows how many website pages receive a certain range of internal links. It also can show how many pages on the site send a range of links to the rest of the site (Outgoing). You can easily see if you have any orphaned pages (pages with 0 internal links) or pages with only one internal link that could be given more links.
- Internal Link Distribution: This is a quick way to see how well your internal linking strategy works. The weak pages in this graph can be improved by adding more internal links pointing to them.
- Internal Link Issues: You can see any issues you may have with your site's internal links. Click on an issue to open the Issues Report with more details.
- Pages passing most Internal LinkRank: Gives you a list of pages that have the most influence on the other pages of the website that they link to.
Creating a smart internal linking strategy is one of the best ways to make your website more crawlable and easier to navigate. For more tips on improving your site’s internal links, read How to Improve Your Keyword Rankings with Internal Linking.
Markups
Markups are how you add structured data items to your website’s code. In turn, structured data can help Google understand your content on a deeper level and give you rich snippets and special SERP features based on the info your markups provide.
This section of the report gives you a grade based on the number of invalid vs. valid structured data items Site Audit found on your site. It will provide a breakdown of your total number of pages with markups, the markup type, and then a list of the actual structured data items we saw on the site.
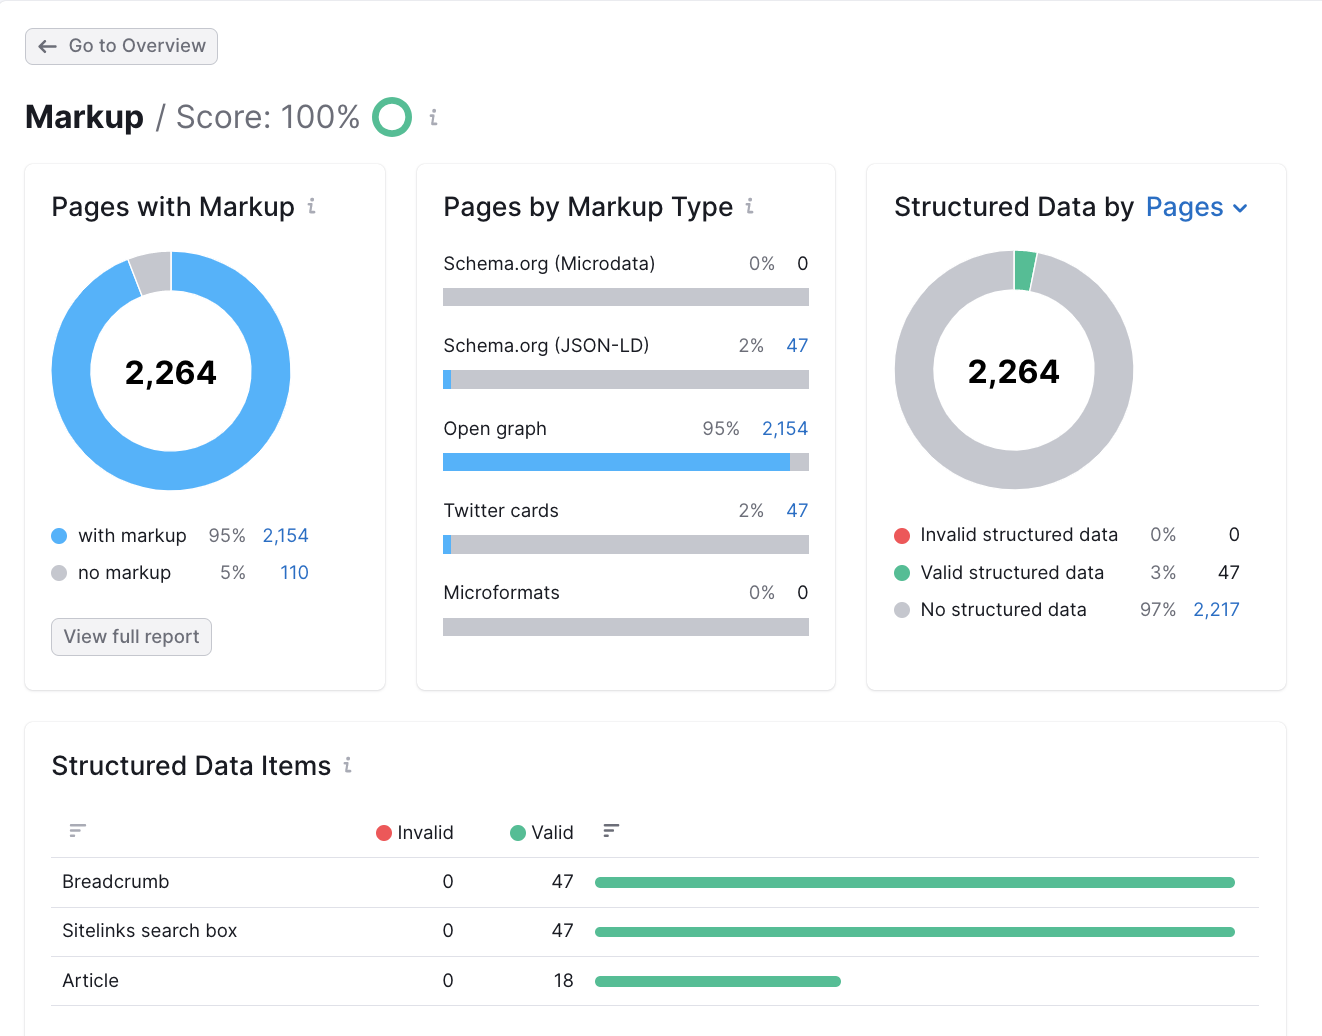
Site Audit can check nearly every structured data markup item in Google’s vocabulary, excluding those in beta.
Core Web Vitals
Core Web Vitals are a set of metrics that measure a website's loading performance, interactivity, and visual stability. It is important for webmasters to address these areas because they are a confirmed ranking factor for Google.
Powered by Google's Lighthouse tool, they are assessed as the Largest Contentful Paint (LCP), which judges the perceived load speed of the page, the Cumulative Layout Shift (CLS), which measures the amount of unexpected layout shift in the visible page content, and the Total Blocking Time (TBT), which is lab-based proxy that quantifies a user's experience upon their first interaction with the page.
This report provides data for a set of 10 pages, selected manually or automatically. Aside from general reports, reflecting the overall performance, Core Web Vitals report shares tooltips on how to improve each metric:
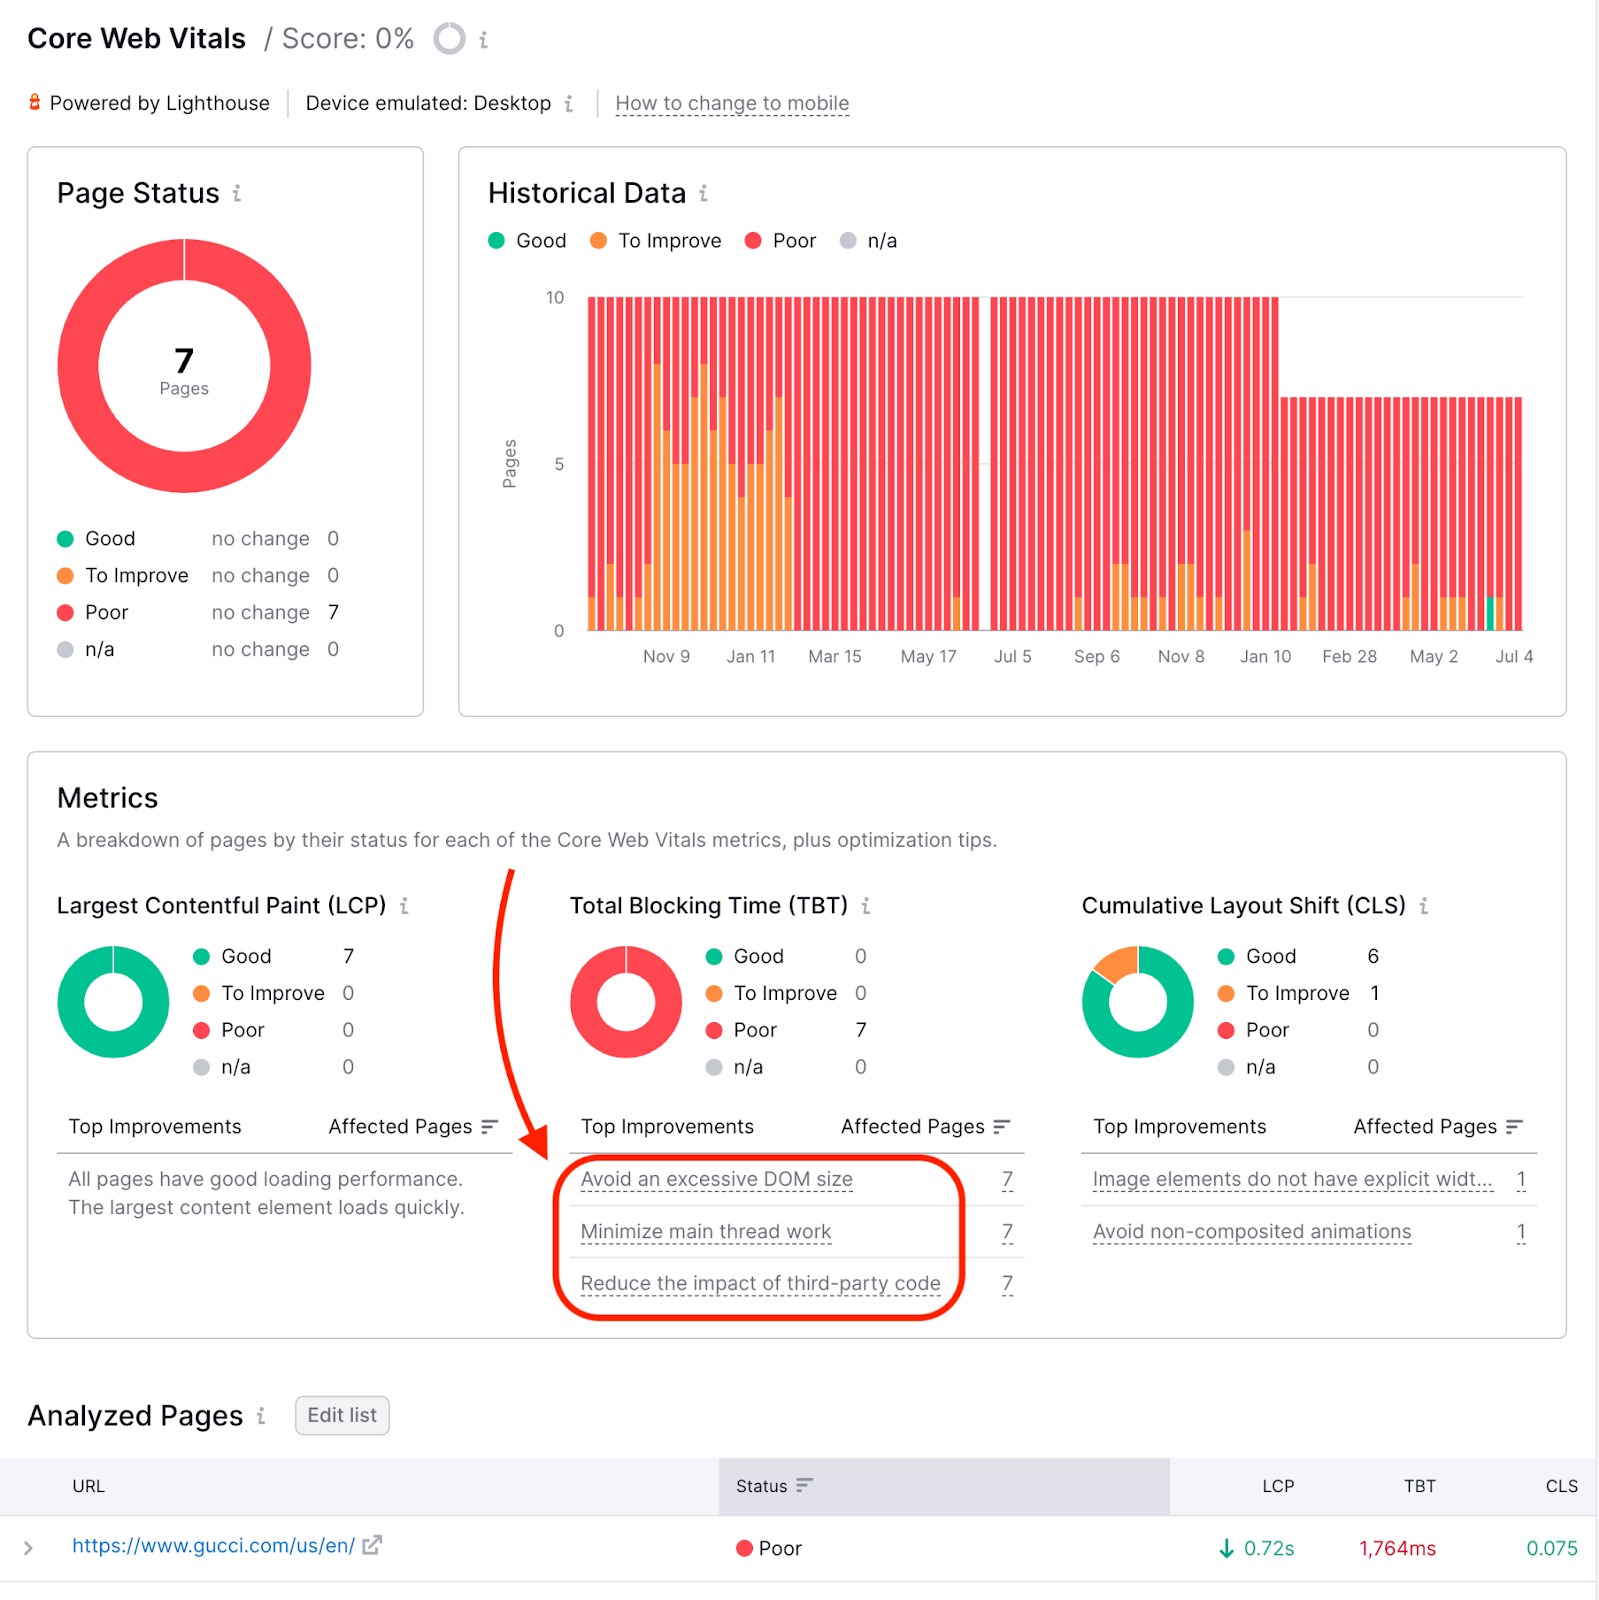
You can review a detailed report for any of the analyzed pages by opening the dropdown menu in the list below: