With the Traffic Journey report, you will be able to understand where your competitor’s audience comes from and where that audience goes next.
This will give you insight into what other sites your competitors' audience is visiting.
Why is this important information? It can tell you:
- Trending destination sites or traffic channels in your niche
- Good websites to place a display advertising campaign
- Which websites your market’s audience frequents
At the top of the report, you will be able to enter 4 of your competitors to benchmark. Once you enter your competitors you will see a graph with traffic channels of all the entered domains.
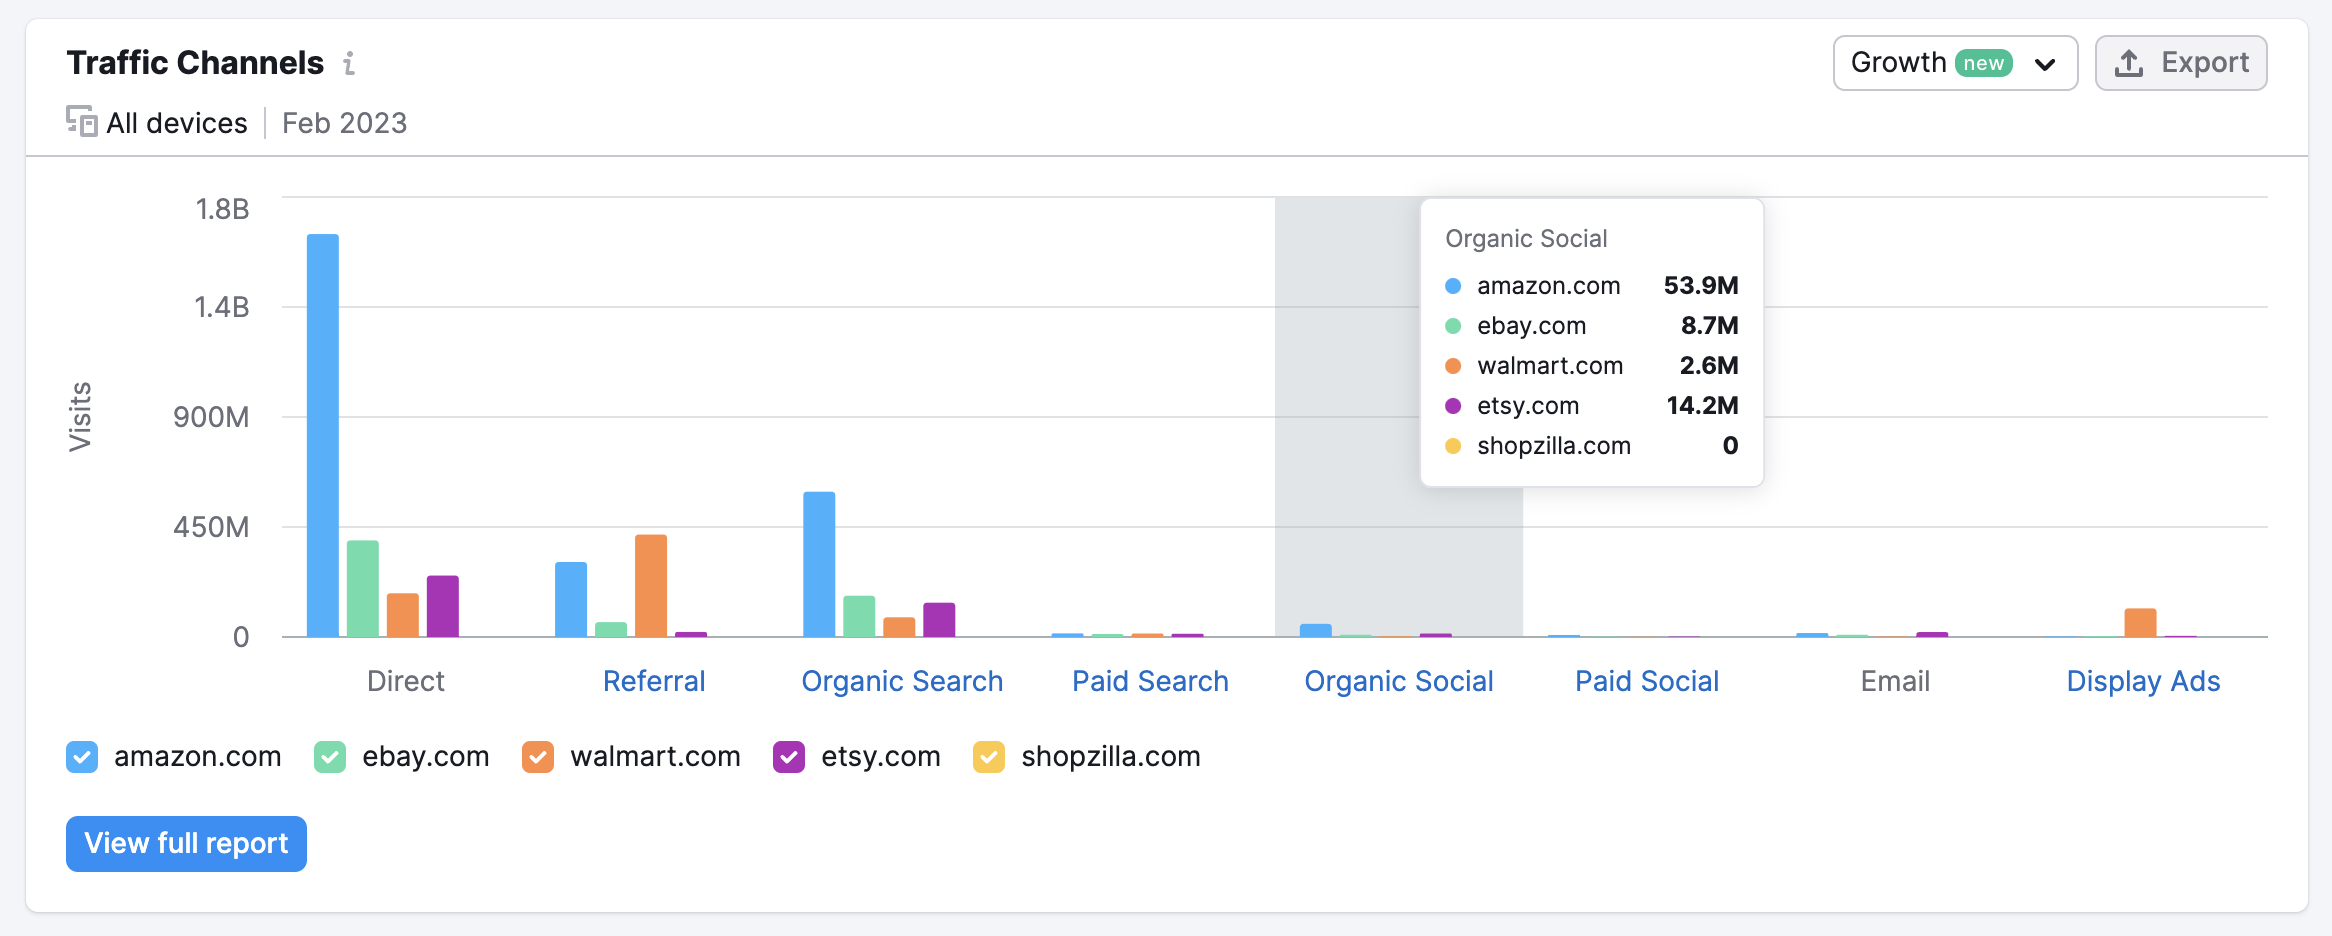
These traffic channels are broken down into direct, referral, organic search, paid search, organic social, paid social, email, and display advertising. Each of the respective sources will have their own bar graph so you can see how you’re stacking up with your competitors in each category.
- Direct — traffic to a domain via URLs entered in a browser’s search bar, saved bookmarks or links from outside a browser (such as PDFs or Microsoft Word documents).
- Referral — traffic to a domain from a hyperlink on another domain (as long as it is not a Social Media domain).
- Organic search– traffic to a domain directly from organic results on a SERP from a search engine such as Google, Bing, DuckDuckGo, etc.
- Paid search– traffic to a domain driven by text, PLA, local, or any other kind of paid advertisement on a SERP from a search engine such as Google, Bing, DuckDuckGo, etc.
- Organic social– traffic to a domain from links on social media websites like Facebook, Twitter, Reddit, Pinterest, YouTube, etc.
- Paid social– traffic to a domain from paid advertisements on social media websites like Facebook, Twitter, Reddit, Pinterest, YouTube, etc.
- Email– traffic to a domain via email services such as Gmail, Yahoo, iCloud or domains with corporate email addresses.
- Display ads– traffic driven to a domain through a display or video ad supported by an advertising platform such as GDN or doubleclick.
With this information, you can identify any competitor’s strengths and weaknesses in their digital strategy. Do they rely more on direct traffic or search? Referral or social?
This can give you insight into their marketing strategy. Not only that, but it can also help you determine if you should avoid marketing in a certain channel.
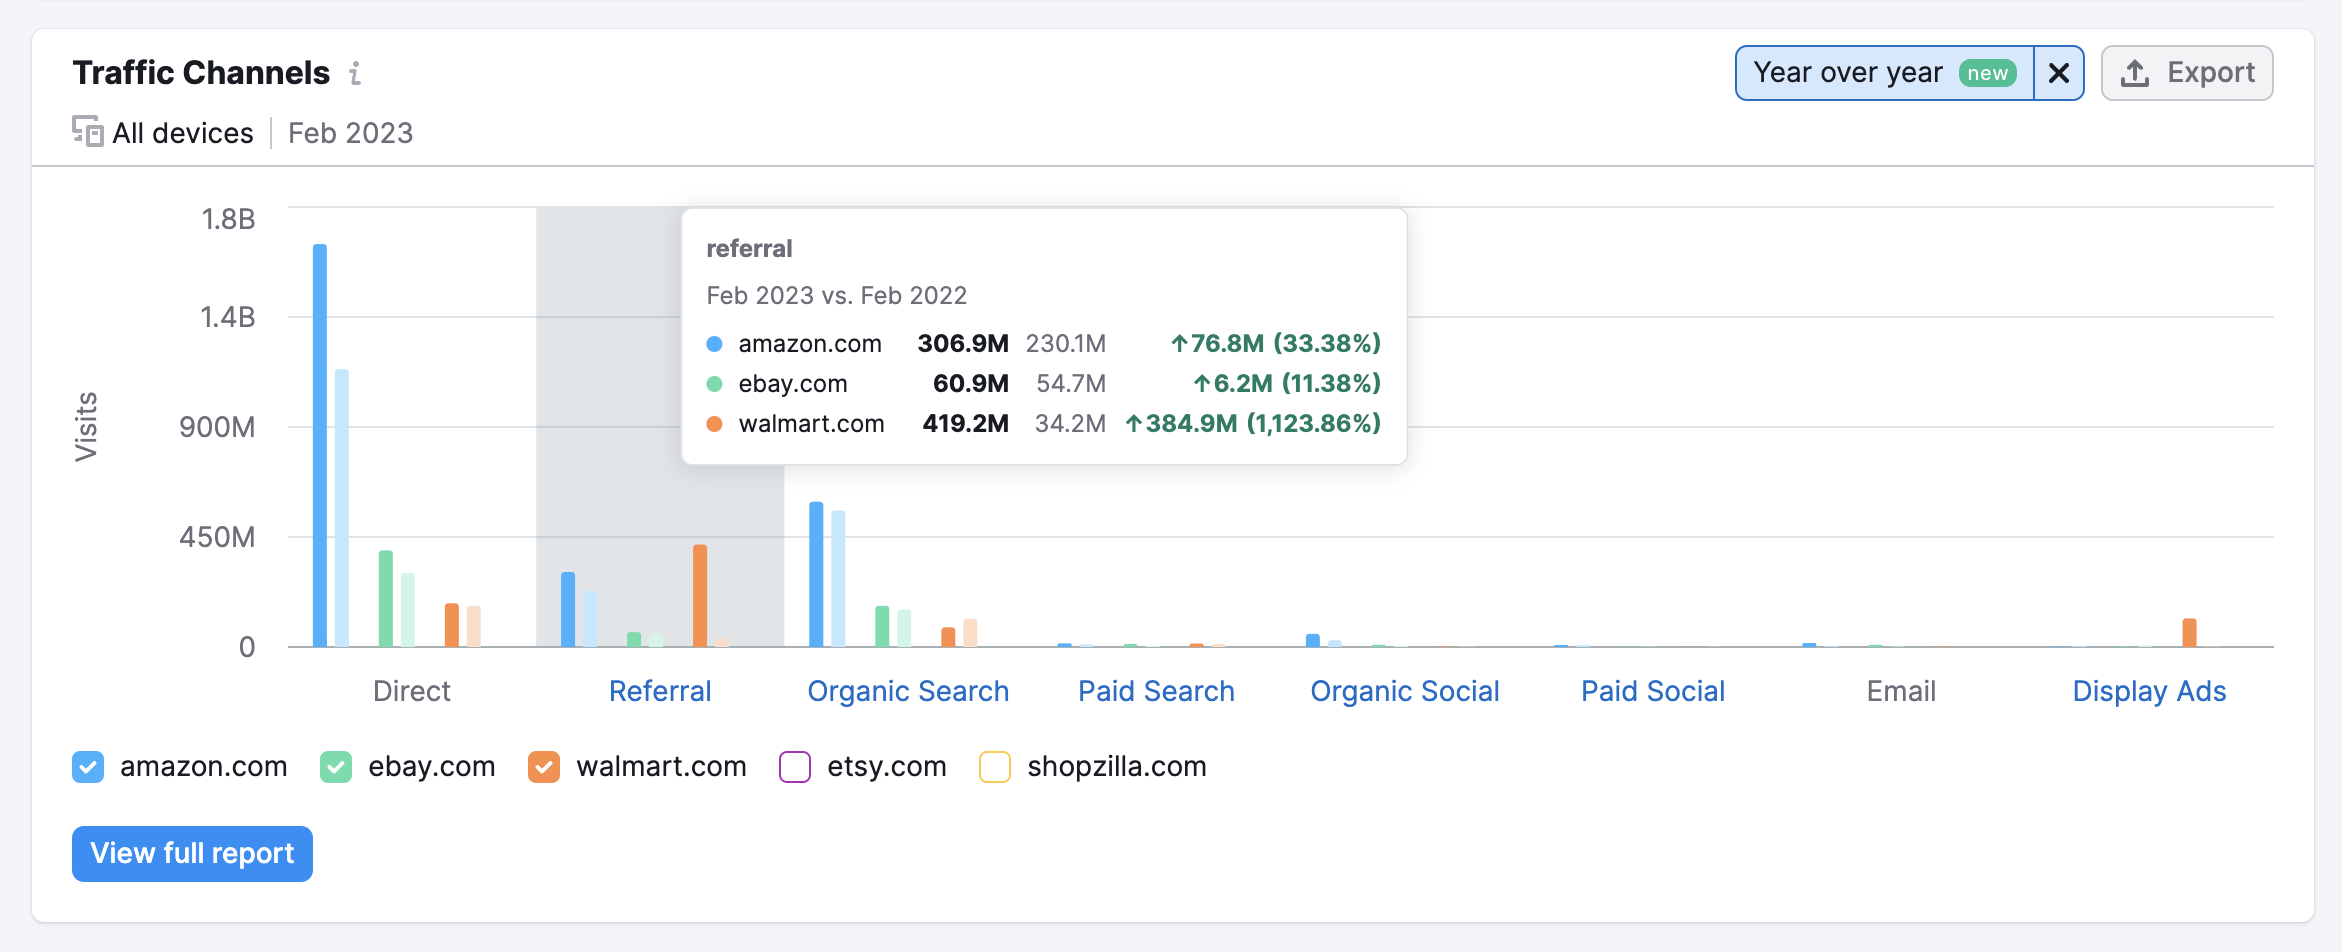
Additionally, you can enable the Growth chart to compare the changes in traffic that come from each of the sources over the selected time period.
Directly below the Traffic Channels graph, you can find the Traffic Journey widget. This will allow you to monitor the traffic that comes from different sources to each of your compared domains. Using this report will show you exactly what sites users are visiting, as well as where they are going after visiting the domain.
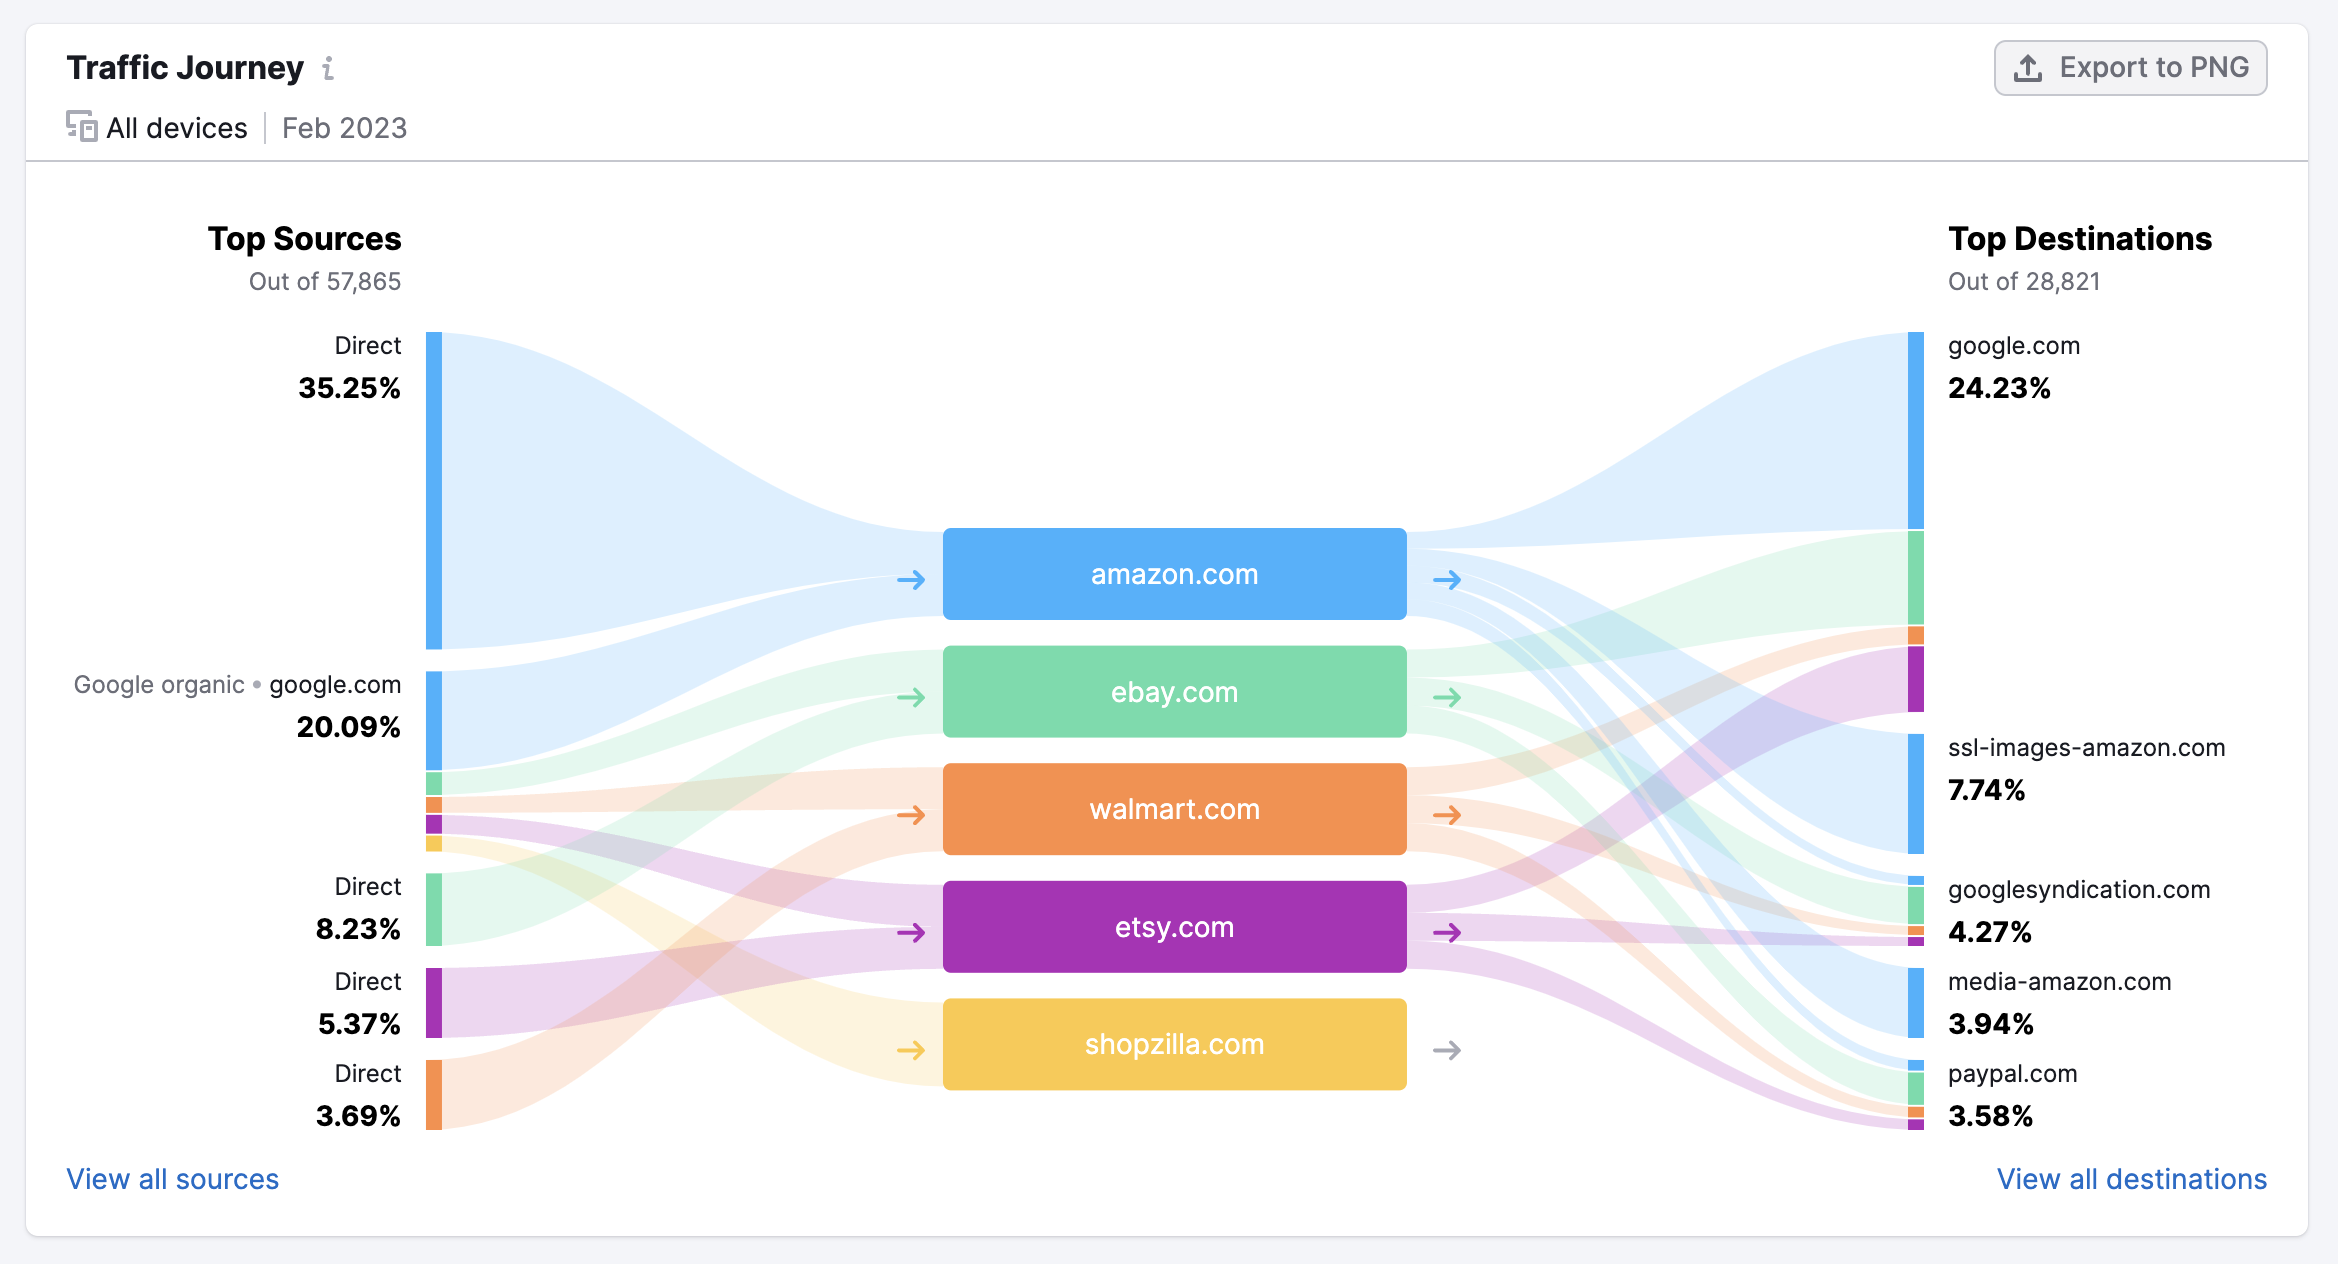
In the Traffic Journey widget, you can see the percentage of total traffic that comes from the given sources to the analyzed domains, as well as the percentage of total traffic sent from the analyzed domains to the top destination websites. This widget illustrates data about the top sources and destinations from the table Traffic Journey Details located below.
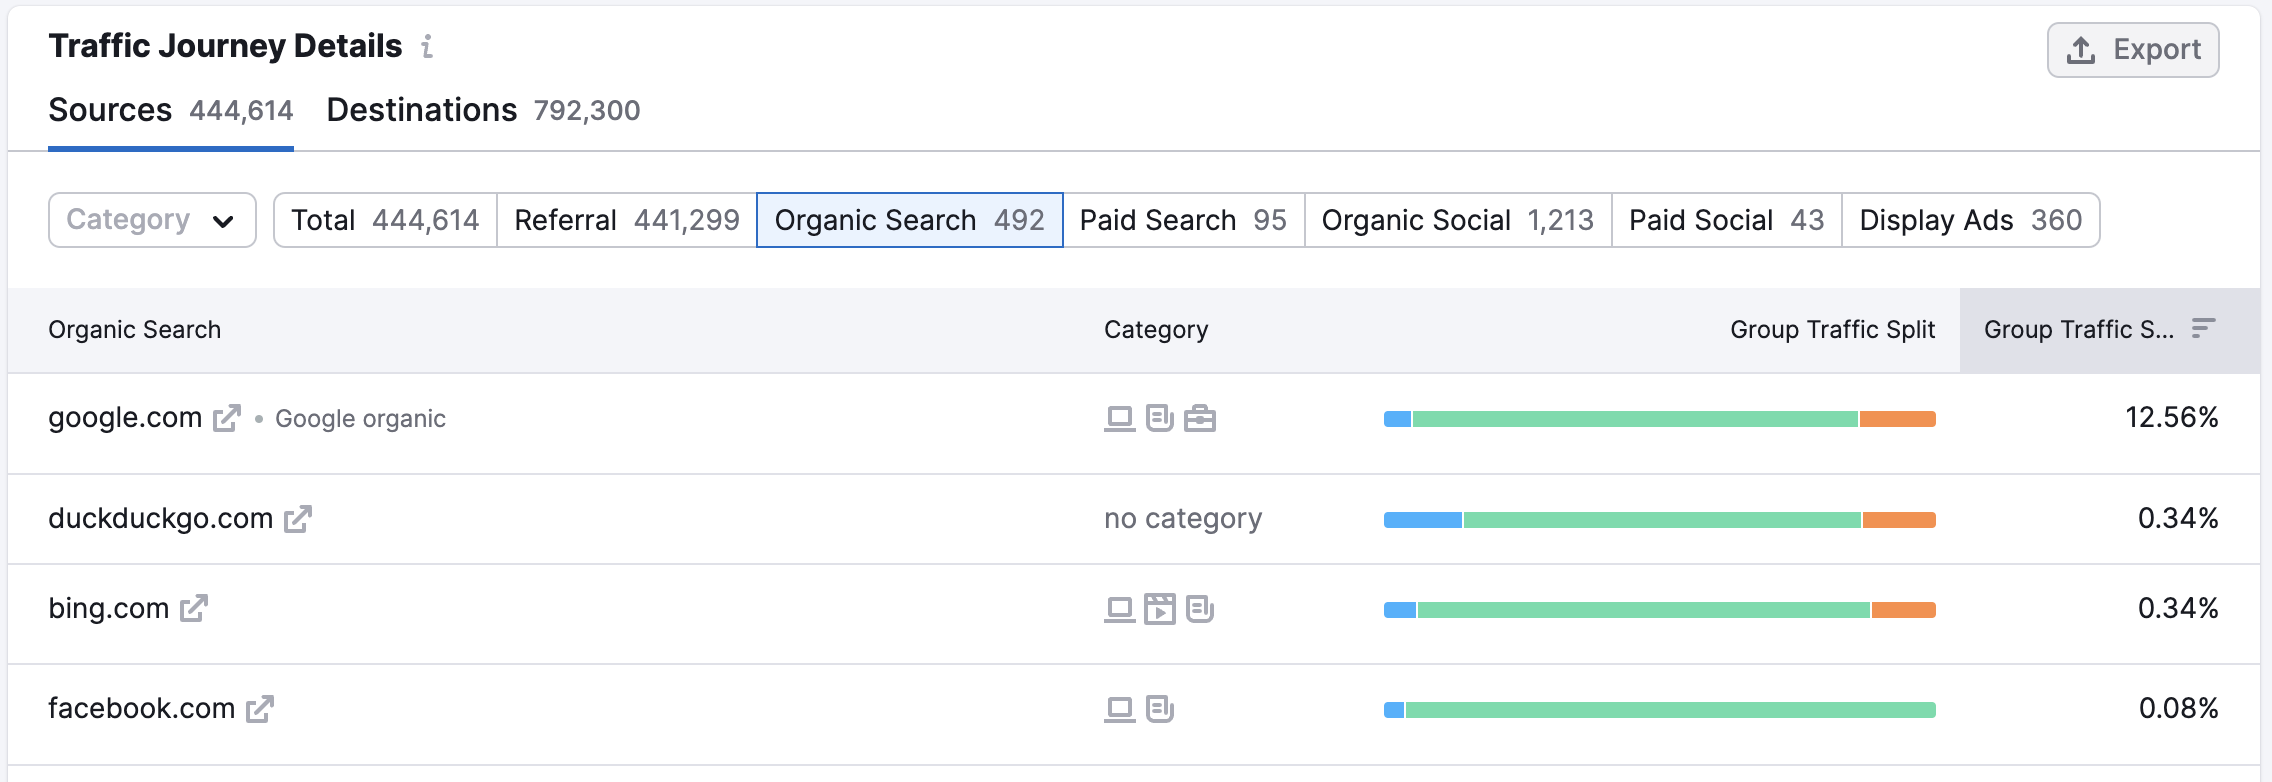
In the table, you will see the traffic channels broken down into Source Domain, Category, Channel, Group Traffic Split, and Group Traffic Share. Group Traffic Split visually breaks down each traffic source into percentages and Group Traffic Share shows the overall percentage of traffic driven from a single domain.
For example, below you can see that naturally, organic traffic from Google is bringing in the highest traffic share.
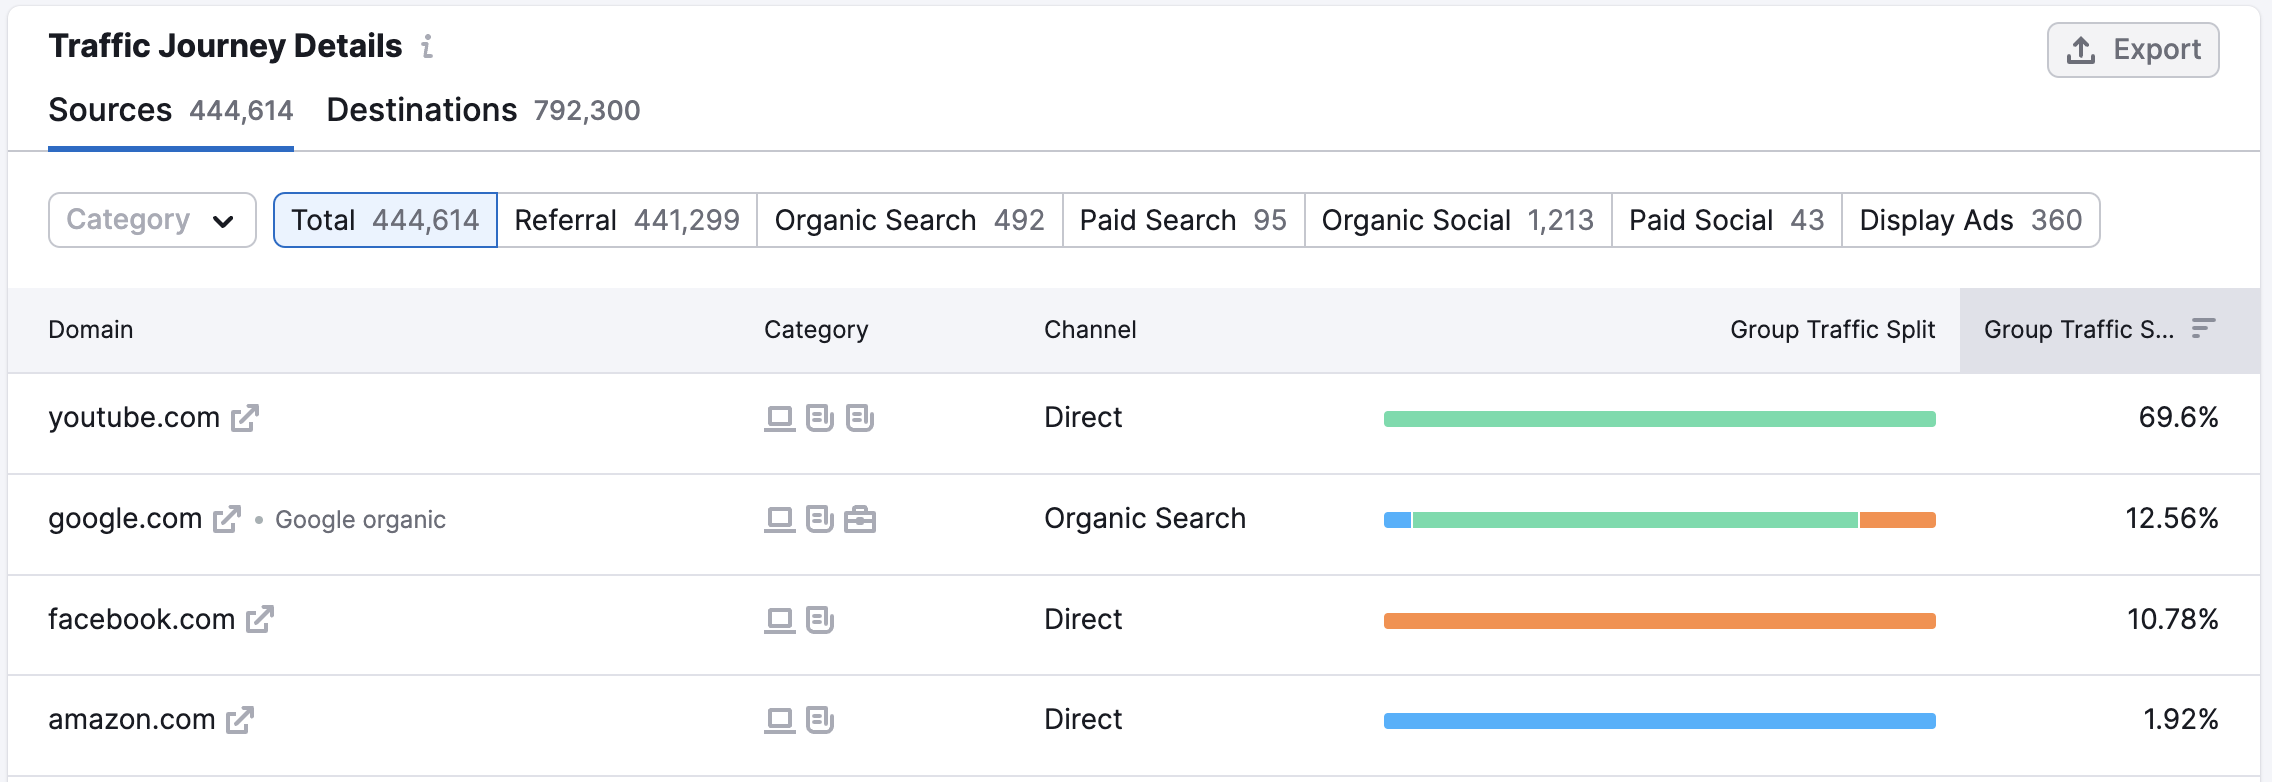
You can filter traffic by Total, Referral, Organic Search, Paid Search, Organic Social, Paid Social, or Display Ads. Click on the tabs above the table to filter by each specific source. Click on the tabs above the table to filter by each specific source.
The websites that send the most traffic to the queried domain through hyperlinks are the referring sites. Use this list to identify your competitor’s most beneficial partnerships on the web.
In the Paid and Organic Search tabs, you can identify if a website is not only found on Google but also search engines like Bing, Baidu, DuckDuckGo, Yahoo, and more. If you see that your competitor is getting a lot of traffic from a secondary search engine in addition to Google, it might be good to make note of that in your competitive analysis and consider exploring a PPC advertising or SEO campaign on another search engine.
The Paid and Organic Social list estimates how much of your competitors’ traffic comes from various social media networks. Because social media marketing can be done from so many platforms other than just Facebook and Twitter, this is a great way to gather ideas from your competition’s top social networks.

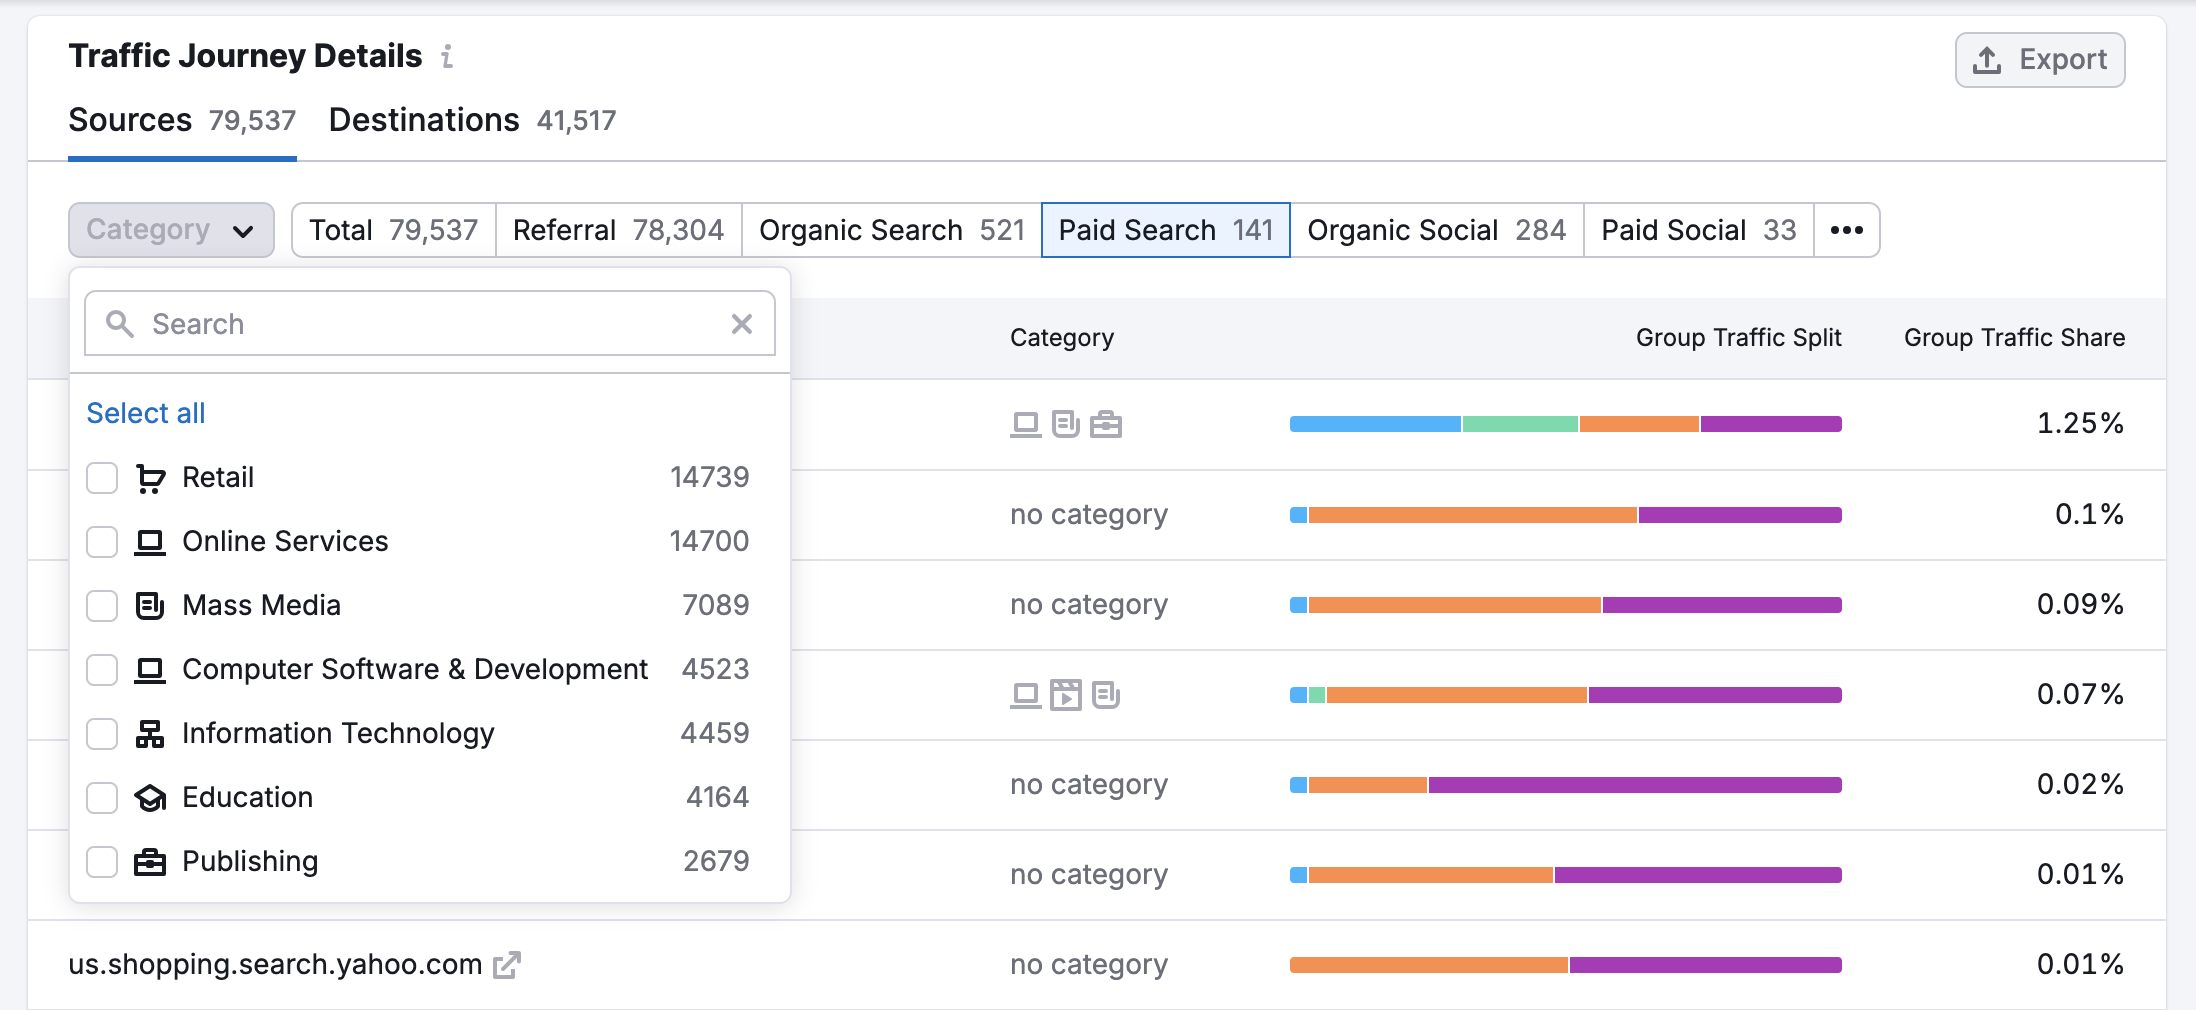
To narrow down your search results in the table, you can use the Category filter. It is available in both tabs Traffic Channels and Destination Sites. The filter makes it easier to discover the most promising platforms for ad placement and marketing partnerships in a specific field.
Please note that each of these tables can be exported to a CSV or Google Sheets file with the “Export” button above the table to the right.